Across the UK there has been a reduction in the number of children and young people (CYP) presenting acutely to hospital during the COVID-19 pandemic. This was highlighted in a recent survey of consultant paediatricians in the UK and Ireland1. It showed that not only were fewer children being brought to emergency departments, but there were also delays in acute presentation of critical illness (such as sepsis and diabetic ketoacidosis) and reductions in referrals for cancer treatment and child protection assessments1.
The reasons for the reduced attendance are thought to be related to the initial government messaging of Stay Home, Protect the NHS, Save Lives2. However, as it became clear that not only parents, but other potential patients were not presenting even if warranted, the government adjusted the messaging to make it clear that the NHS was still open for urgent care that was not just COVID-19 related.
In CYP the cause of delayed presentations were likely to be manifold: parents following the initial governmental message; families concerned that hospitals were unsafe; the initial presumption that COVID-19 in CYP would present in the same manner as in adults potentially leading to primary care and NHS 111 pathways channelling them to domestic isolation. It may be that some delays in hospital presentations may be due to reduced referrals from primary care, and that in turn may be influenced by fewer CYP accessing their local General Practice facility. The ‘Take the Temperature’ survey which assessed the views of 1535 respondents (predominantly aged 16-25 years) found, “85% knew that they shouldn’t go to a doctor if they got the virus”3. However, it is possible that CYP and parents may not be able to make the often challenging differentiation between symptoms of COVID-19 and what may be another illness in need of medical attention.
There has been a significant increase in pressure on many aspects of the health service, including on primary care. Automated telephone messages have been used as a tool by General Practice to direct service users to the correct service or point of care for some time. As such, it is unsurprising that automated messages may be used to try to address some questions about the pandemic prior to speaking to a call handler at a practice. In addition to this, significantly limiting face to face contact with patients during the pandemic in Primary Care has been essential to prevent the potential spread of the virus and closure of services. We aimed to review the initial advice that parents and carers may be receiving from their first point of contact when telephoning their local General Practice and whether this considered CYP specifically.
Methods All General Practices within four Clinical Commissioning Groups (CCGs) in NHS Sheffield CCG, NHS Manchester CCG, NHS Leeds CCG and NHS Birmingham and Solihull CCG were identified using the NHS website. These were chosen as they are large cities, with diverse populations.
Practices were only contacted within their standard opening hours by three of the authors, within a four-day time period (7th July 2020 to 10th July 2020). The data collected is shown in table 1. All practices were telephoned and identified as to whether they had the following (see table 1):
Table 1: Questions asked during data collection
Was there an automated message?
Yes/No
Was COVID-19 was mentioned in the automated message?
Yes/No
Was there was advice to stay away from the practice if COVID-19 symptoms present?
Yes/No
Was there advice to self-isolate with COVID-19 symptoms
Yes/No
Was there any age segmentation or differing advice for children?
Yes/No
If worsening COVID-19 symptoms, was there advice to go to NHS website or telephone NHS 111 service?
Yes/No
What was the length of the automated message (In seconds)?
Percentages, means, standard deviation, and standard error of the mean were calculated. Proportions were compared using Fisher’s Exact test to calculate statistical significance of some data.
Table 2: Reasons for exclusion from analysis
Reason for exclusion from analysis
Number of practices
Private screening clinic
1
Duplication of practice already listed
5
Permanently closed
1
Call failed or no telephone number available
4
Line busy despite repeated attempts
1
Total
12
In total, 549 practices were listed under these four CCGs. 12 practices were excluded (see table 2), leaving 537 practices from which we could obtain results.
Table 3: Analysis of results from 537 GP practices
ALL GPS COMBINED
Automated message
Coronavirus mentioned in automated message
Advice to stay away from practice if coronavirus symptoms
Advice to self-isolate with coronavirus symptoms
Did have age segmentation
Advice if worsening COVID-19 symptoms to go to NHS Website or phone 111
Length of automated message (seconds)
TOTAL
440
290
153
120
5
169
23694
% of surgeries contacted
81.9%
54.0%
28.5%
22.3%
0.9%
31.5%
% of surgeries with automated message
100.0%
65.9%
34.8%
27.3%
1.1%
38.4%
Mean
54.1
Standard Deviation
26.9
Table 3 demonstrates that of the 537 practices, 81.9% (n=440) had an automated message. When an automated message was present, the mean length was 54.1 seconds (SD = 26.9). Of all of the practices with an automated message, 65.9% (n=290) mentioned ‘coronavirus’ or ‘COVID-19’ in their message, 34.8% (n=153) gave specific advice to stay away from the practice if the caller had symptoms of COVID-19, 27.3% (n=120) gave advice about self-isolating with COVID-19 symptoms, and 38.4% (n=169) re-directed callers to telephone NHS 111 or visit the NHS 111 website for advice on worsening symptoms. Only 1.1% (n=5) practices mentioned children specifically. Of these, two said that the advice about self-isolating also applied to children, and the other three said the following: “…anyone with a new continuous cough or fever of 37.8 degrees centigrade or higher must self-isolate for 7 days. This includes children. Travel history is now irrelevant. Anyone with these symptoms who are well are to stay at home and do not need to ring 111 or be tested. Anyone with these symptoms who are unwell should go to NHS 111 online for advice. You must not come to the surgery…” “…anyone with a new continuous cough and/or a high temperature should stay at home and self-isolate for the next 7 days. This includes children. All other members of your household will need to self-isolate for 14 days even if they remain asymptomatic. Do not attend the university health service, hospital, pharmacy or other NHS service in person. If you have these symptoms, use the NHS 111 online coronavirus service to find out what to do. Do not call NHS 111 unless you cannot get help online…”
“…anyone with a new continuous cough, a fever of 37.8 degrees or higher, or a loss or change to your sense of smell or taste must self-isolate for 7 days. This includes children. Anyone with these symptoms who are well must stay at home and order a COVID-19 test… Anyone with these symptoms who are unwell should go to 111 online for advice. You must not come to the surgery…”
Sheffield CCG had the fewest number of automated messages compared with all the other CCGs:
Sheffield CCG (n=75, 70.8%) vs Leeds CCG (n=119, 88.8%) p<0.0005;
Sheffield CCG (n=75, 70.8%) vs Manchester CCG (n=74, 81.3%) p=0.0974;
Sheffield CCG (n=75, 70.8%) vs Birmingham and Solihull CCG (n=172, 83.5%) p=0.012.
Sheffield CCG had the most automated messages with advice to stay away from the practice compared with the other CCGs:
Sheffield CCG (n=44, 58.7%) vs Leeds CCG (n=34, 28.6%) p<0.0001;
Sheffield CCG (n=44, 58.7%) vs Manchester CCG (n=26, 35.1%) p=0.0052;
Sheffield CCG (n=44, 58.7%) vs Birmingham and Solihull CCG (n=49, 28.5%) p<0.0001.
Manchester CCG had the fewest messages with advice to self-isolate compare with the other CCGs: Manchester CCG (n=9, 12.2%) vs Leeds CCG (n=30, 25.2%) p=0.0415;
Manchester CCG (n=9, 12.2%) vs Sheffield CCG (n=26, 34.7%) p=0.0018;
Manchester CCG (n=9, 12.2%) vs Birmingham and Solihull CCG (n=55, 32%) p=0.0009. See Table 4.
Table 4: Breakdown of results for individual CCGs
CCG
% of surgeries with automated message
% Coronavirus mentioned in automated message
% Advice to stay away from practice if coronavirus symptoms
% Advice to self-isolate with coronavirus symptoms
% Did have age segmentation
% Advice if worsening Covid-19 symptoms to go to NHS website or phone 111
Mean length of message in seconds (95%CIs)
Sheffield (n=106)
70.8 (n=75)
62.7 (n=47)
58.7 (n=44)
34.7 (n=26)
4.0 (n=3)
34.7 (n=26)
52 (46-57)
Leeds (n=134)
88.8 (n=119)
62.2 (n=74)
28.6 (n=34)
25.2 (n=30)
1.7 (n=2)
53.8 (n=64)
56 (51-60)
Manchester (n=91)
81.3 (n=74)
68.9 (n=51)
35.1(n=26)
12.2 (n=9)
0 (n=0)
56.8 (n=42)
58 (52-64)
Birmingham and Solihull (n=206)
83.5 (n=172)
68.6 (n=118)
28.5 (n=49)
32.0 (n=55)
0 (n=0)
21.5 (n=37)
52 (49-56)
Automated messages were all in English (although a small number of practices provided a translation in other languages after the message) and orated by a mixture of computerised voices, doctors or staff from the practice. Many automated messages indicated a range of options for the caller to be re-directed to a different line (such as to arrange an urgent appointment or to obtain a repeat prescription) but for the purposes of this study, the key data points listed in table 2 were the only parts of the message which were recorded.
There was no statistically significant difference in mean message length between the four CCGs. Sheffield CCG 51.7 seconds (95% confidence interval 46.5 to 56.8); Leeds CCG 55.7 seconds (95% confidence interval 51.2 to 60.1); Manchester CCG 58.0 seconds (95% confidence interval 52.2 to 63.7); Birmingham and Solihull CCG 52.4 seconds (95% confidence interval 48.7 to 56.0) (p<0.05).
Discussion
This study found that very few practices specifically mentioned children in their automated messaging in relation to the current pandemic. 81.9% of the practices contacted had automated telephone messaging. Of these, 65.9% mentioned COVID-19 in their message but only 1.1% (n=5) specifically mentioned children in their message.
38.4% of practices re-directed callers to either the NHS website or NHS 111 telephone advice line. The website advice states, "Call 111 if you're worried about a baby or child under 5. If your child seems very unwell, is getting worse or you think there's something seriously wrong, call 999”4. There is also further advice particularly focussed upon babies and very young children on the website. This is helpful advice for parents or carers of an unwell child and it is important that it is emphasised. However, it relies upon parents and carers to make an assessment as to when something may be getting worse or is ‘seriously wrong’. Whilst this would increase the workload for primary care, it perhaps would be more beneficial for CYP, particularly those under 5 years to be triaged by a call handler at the local practice and have a much lower threshold for a telephone consultation with a clinician at the surgery or advice to attend hospital.
This study provides a timely representation of first point of care health advice which is being provided in England during the current pandemic. It seeks to look specifically at automated advice given to CYP and whether this may contribute the delays in presentation to secondary care for acutely unwell CYP which have been seen.
It is difficult to know for certain how this may be directly attributable to the reported delays in presentation of serious illness.
Practices from within only four CCGs were contacted in this study. However, this covered a sizable number of different practices, 537 in total, all of which were in large cities and towns in England. It is notable that we did not assess any advice that may have been given by those answering the telephone call. Once the automated message had been completed there may have been opportunity to provide targeted advice. Also, for the 18.1% (n=97) practices where there was no automated message, we do not know if any further advice is relayed by those answering the call. It may have been at this point when age specific advice might have been received.
To our knowledge there have been no other studies looking at the spectrum of automated messages in General Practice during the COVID-19 pandemic.
This study highlights the need for tailored and consistent advice for CYP specifically during the COVID-19 pandemic.
There is significant variation in the advice being given by different General Practices. The Royal College of General Practitioners (RCGP) states that ‘as with all patients, children should be triaged prior to any face to face consultation’ and ‘every effort should be made to avoid face to face assessment’5. It is very important to note that the pandemic has been an extremely challenging time for General Practice with rapid adaptations to working being made in a very short time period. There have been repeated changes in guidance which highlight the challenges faced by General Practice in providing the most up to date information. Since 18th February 2020, patients with a travel history or suspected symptoms were advised to call NHS 111 and to not go to their local General Practice, pharmacy or hospital6. On 5th March 2020, General Practitioners (GPs) were advised by NHS England to switch to a telephone-only triage system, to reduce the change of potentially infected patients attending the practice7. The latest NHS England Standard operating procedure for General Practice (at the time of writing; 24 June 2020, Version 3.3)8 offersspecific advice for GPs regarding children; “Prolonged illness and/or severe symptoms should not be attributed to COVID-19 and should be evaluated as usual”. The rapidly changing advice, coupled with large amounts of uncertainty and anxiety among staff in Primary Care may have contributed to the challenges of providing consistent, standard information for service users such as through automated messaging. For some practices, a telephone triage service was a completely novel way of working, making this large process change over a very limited time frame must have been extremely challenging.
Logistically, the ability to alter automated telephone messaging is often not straightforward and, in many cases, requires outsourcing of this to external companies. This requires an already pressured service to keep up to date with rapidly altering advice whilst arranging for a staff member to formulate a new script and then arrange for this recording to be amended. A process which would have been required to be repeated multiple times over the preceding months, due to regularly changing government messaging.
Although evidence continues to emerge, we know that COVID-19 is less likely to develop into serious illness in healthy children and adolescents compared to adults9.
There have been concerns regarding a serious but rare complication of COVID-19 infection in children PIMS-TS (paediatric inflammatory multisystem syndrome temporarily associated with SARS-CoV-2). A recent paper in the Lancet10 reviewing children admitted to PICUs in the UK between 1st April 2020 and 10th May 2020 suggested that incidence of PIMS-TS requiring intensive care was around 1.5%. However, at the time only hospitalised patients were being tested for COVID-19 in the UK, so this does not take into account the number of children who may have had COVID-19 but were not tested. As a result, it is likely to be an overestimation. Whilst this condition can be serious, the likelihood of a child progressing to PIMS-TS after developing Covid-19 remains low. The greater concern is delayed presentation of other serious illness.
As other publications have suggested, there is a greater risk that children may delay in presenting to hospital or be delayed in being referred to secondary care for important investigations due to the widespread ‘stay away’ advice, seen in both the UK11 and in Europe12.
We suggest that adapting the messaging that parents or carers receive when they first contact their GP to include CYP would be possible and may reduce the number of unwell CYP who have delays in receiving medical care. It would also be important to aim to have consistent messaging across different practices, advice which perhaps should be standardised at a national level. This could greatly assist those working in Primary Care to be able to provide accurate and up to date messaging for their patients. Any adaptations required could be made by individual CCGs to take account of local differences.
Increased amounts of wider public health messaging directed towards encouraging parents and carers to seek medical advice if they are worried about their child, despite the pandemic, are paramount to aid in getting this vital message to those caring for CYP. It is important that additionally where appropriate, this advice is also available in languages other than English.
This study does not prove a direct link between the advice provided at the first point of contact in Primary Care and the delays in CYP presenting to hospital with serious illness. We do not know what influence the advice on automated messages has over CYP and their parents in their decision making about accessing care. Future research should seek to answer this question specifically, perhaps involving directly interviewing CYP and their parents or carers.
General Practice is the first point of contact for most patients who ask for professional medical advice in the United Kingdom (UK) National Health Service (NHS)1. Primary care makes up around 90% of all NHS activity and, as a result of increasing populations overtaking the number of newly qualified General Practitioners (GPs), the burden of tasks from patients has increased exponentially. GPs characterise their workload as “unmanageable” or “unsustainable” and 93% have reported that patient care has been subsequently affected.1 Funding into General Practice from the NHS expenditure has fallen by almost 20% which has halted the expansion of new practices and recruitment of substantial GPs. The growth of new GPs increased by 0.2% only, between 2009-2014, and this has indirectly pressured existing doctors to care for more patients. This is reducing job morale as well as patients’ satisfaction with services. The main causes of increased workload are increased administrative load, high patient expectations and increased risk of litigation.2
Four years ago, there were four doctors at our practice. As time passed, one doctor emigrated, another doctor passed away and the third had retired. This has left two doctors at the practice at this current time. The practice currently employs locum GPs to cover the pressures of daily patient appointments as, according to new studies, there are now on average an astonishing 2,100 registered patients per GP.3 The loss of permanent doctors in this practice may be due to the location of the GP surgery. Barnsley, according to uSwitch in 2015, was ranked 122 out of 138 local areas across the UK based on 26 factors such as household income, life expectancy, hours of sunshine and the cost of essential goods including food bills, fuel costs and energy bills.4 Adding to the lack of permanent GPs, recruitment into General Practice as a specialty has been scarce. Studies have shown that medical graduates chose medical careers that they considered as more stimulating and interesting. One study mentions that medical students are attracted to technical or biomedical forms of medical practice, as opposed to a holistic view of medicine such as that of General Practice.5
Non-permanent GPs in the practice are keen on taking on flexible working hours, which meant the permanent doctors are left with a majority of the work including all of the on-call tasks. These tasks include dealing with patient requests that come through to the receptionist such as booking appointments, patient referrals, prescribing medication and issuing sick notes. We aim to identify the prevalence of specific tasks and evaluate ways to reduce the tasks performed by the doctor. We intend to analyse the number of prescribed acute medication that can be placed on a repeat or variable repeat prescription.
METHODS
Data was collected from a single NHS England GP Centre. This centre utilizes the Egton Medical Information Systems (EMIS) web platform for recording consultations, tracking investigation results, prescribing medications, and communicating within the practice.6 Using EMIS, we collected all the tasks of the on-call doctor for a single month. In this month, there were no school or public holidays. These tasks are sent to the on-call doctor from the receptionist who receives them directly from patients. At this centre, all tasks from 2pm on a particular day form part of the following days’ workload. Therefore, the tasks of each day were recorded from 2pm the previous day until 2pm that day.
We separated tasks by allocating them into 1 of 5 categories: medication request; request for appointment, advice, or test results; request for a referral; request for sick note; and other which included all miscellaneous tasks.
RESULTS
Total task distribution
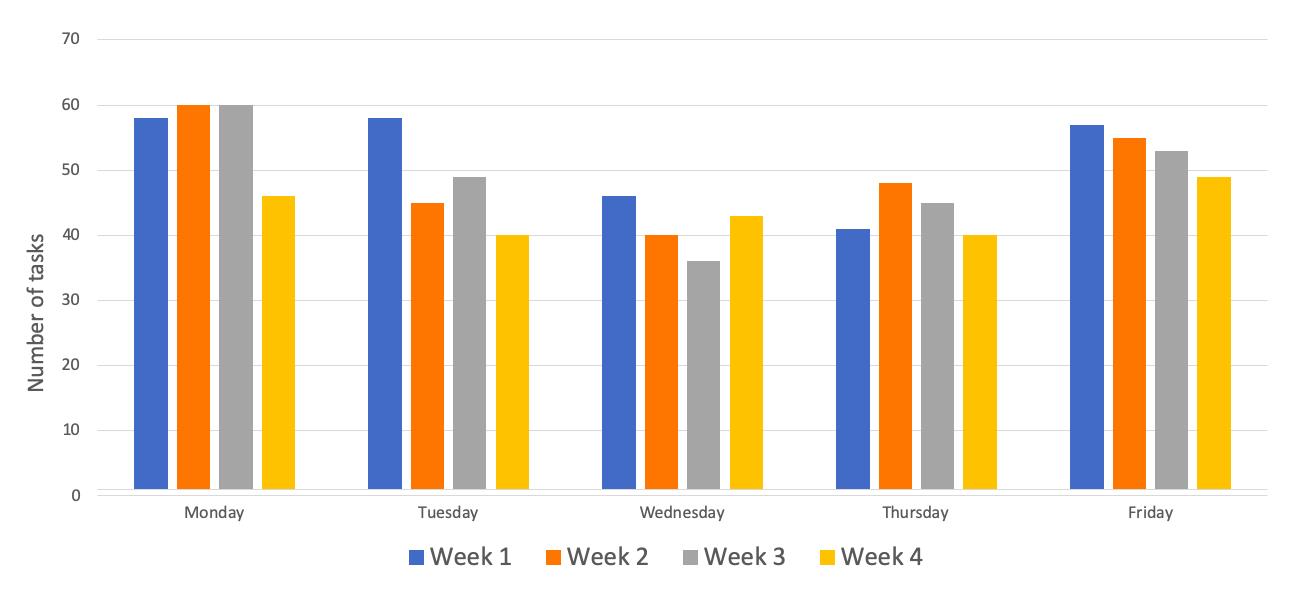
A total of 969 tasks were performed in the month. The proportion of tasks over 4 weeks was as follows: week 1 had 26.7% (n=259) of the total tasks; week 2 had 25.6% (n=248); week 3 had 25.1% (n=243); and week 4 had 22.5% (n=218).
Figure 1: Total number (n) of tasks per day across each week for the four weeks of the month
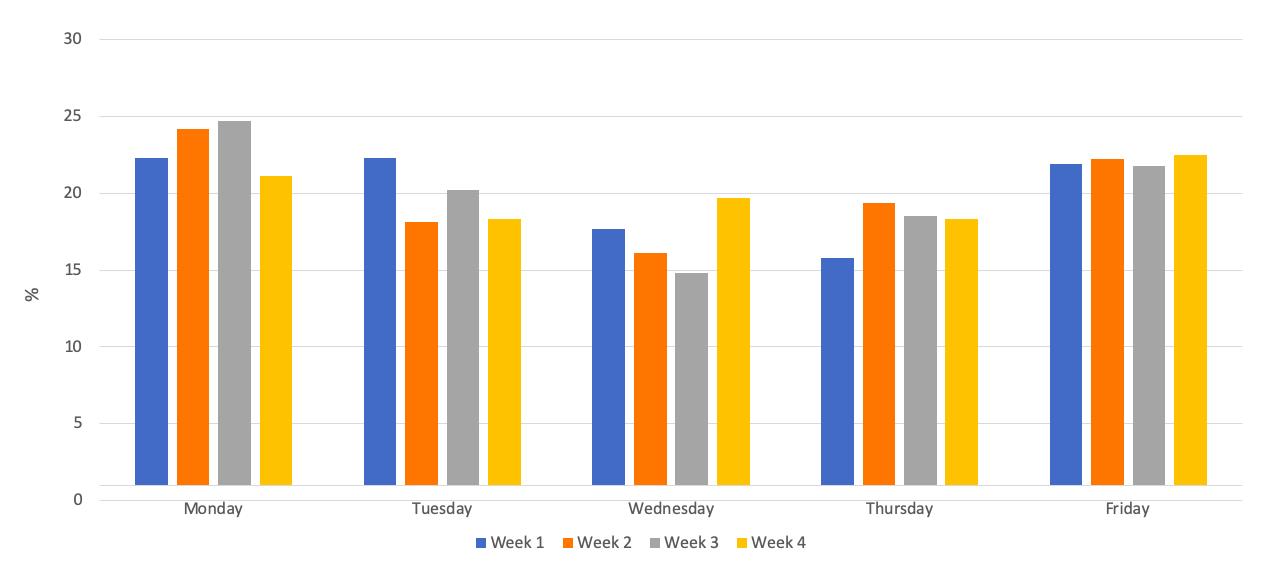
Further to this, regarding the proportion of tasks over the days of the week: Monday had 23.1% (n=224) of the total tasks; Tuesday had 19.8% (n=192); Wednesday had 17.0% (n=165); Thursday had 18.0% (n=174); and Friday had 22.1% (n=214). Figures 1 and 2 show the number and percentage of task distribution respectively across the days and weeks for the month.
Figure 2: Percentage (%) of task distribution per day-of-the-week across each week for the four weeks of the month.
Type of task
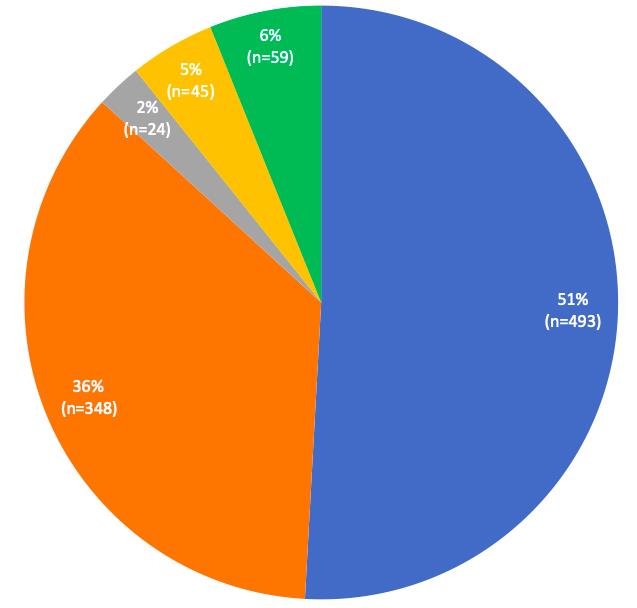
The tasks for the month were separated unevenly across the five categories: medication tasks were 50.9% (n=493) of the total tasks; requests for appointments, results and advice were 35.9% (n=348) of the total tasks; referrals were 2.4% (n=24) of the total tasks; sick note were 4.6% (n=45) of the total tasks; and other tasks made up the remaining 6.1% (n=59) of the month. Figure 3 shows the distribution of tasks for the month.
Figure 3: Distribution of tasks/requests according to task-type for the month (total tasks n=969).
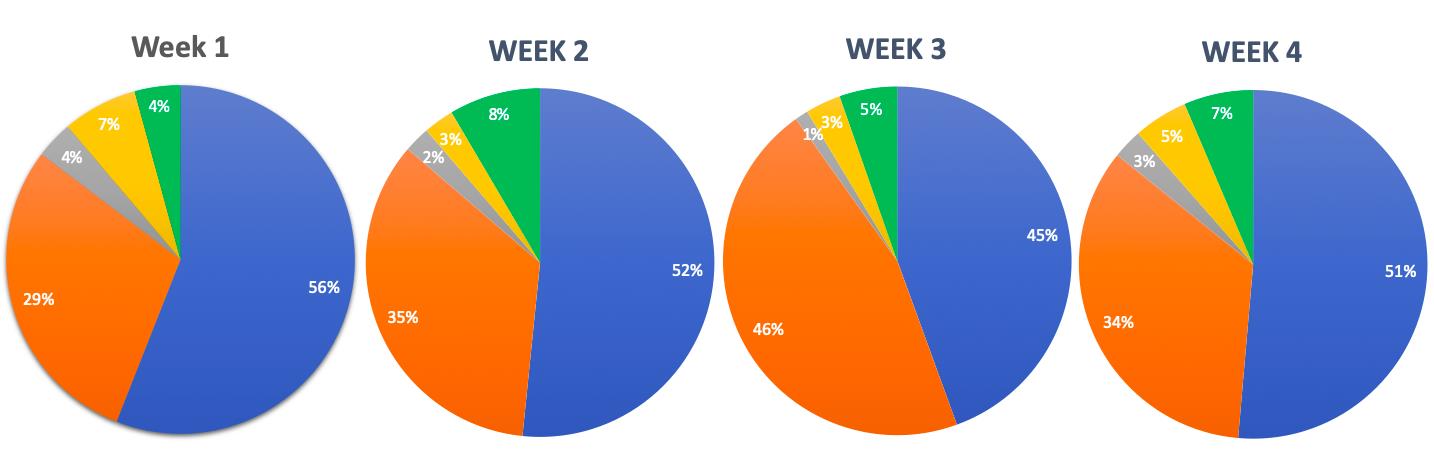
We recorded the type of tasks completed per week. Figure 4 shows the distribution of tasks according to task-type for weeks 1, 2, 3, and 4, respectively. Of the total 260 tasks recorded for week 1, 55.8% (n=145) were tasks involving medication; followed by 29.2% (n=76) request for appointments, results and advice; referrals made up 4.2% (n=11); sick notes were 7.3% (n=19); and miscellaneous tasks came to 3.5% (n=9).
The second week had a total of 248 tasks. Of these, 51.6% (n=128) were medication tasks; 34.7% (n=86) were requests for appointments, results and advice; referrals made up 2.4% (n=6); sick notes made up 2.8% (n=7); and miscellaneous tasks were 8.5% (n=21).
The third week had a total of 243 tasks. Of these, 44.4% (n=108) were medication tasks; 45.7% (n=111) were requests for appointments, results and advice; referrals made up 1.2% (n=3); sick notes made up 3.3% (n=8); and miscellaneous tasks were 5.3% (n=13).
The fourth week had a total of 218 tasks. Of these, 51.4% (n=112) were medication tasks; 34.4% (n=75) were requests for appointments, results and advice; referrals made up 2.8% (n=6); sick notes made up 5.0% (n=11); and miscellaneous tasks were 6.4% (n=14).
Figure 4: Comparison of distribution of tasks/requests according to task-type for week 1, 2, 3, and 4, respectively.
Medication tasks
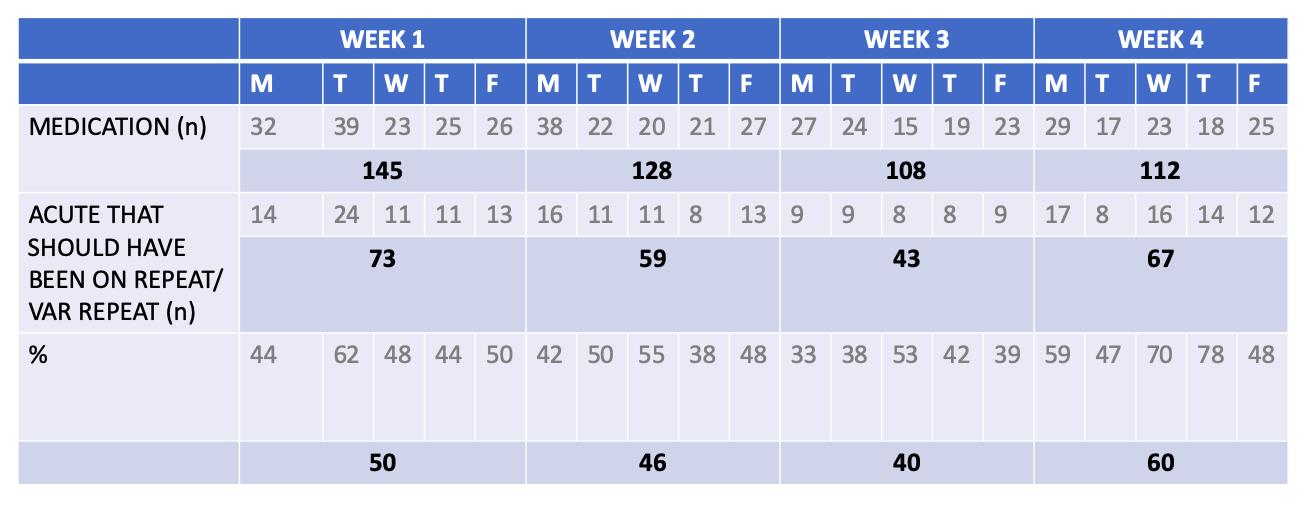
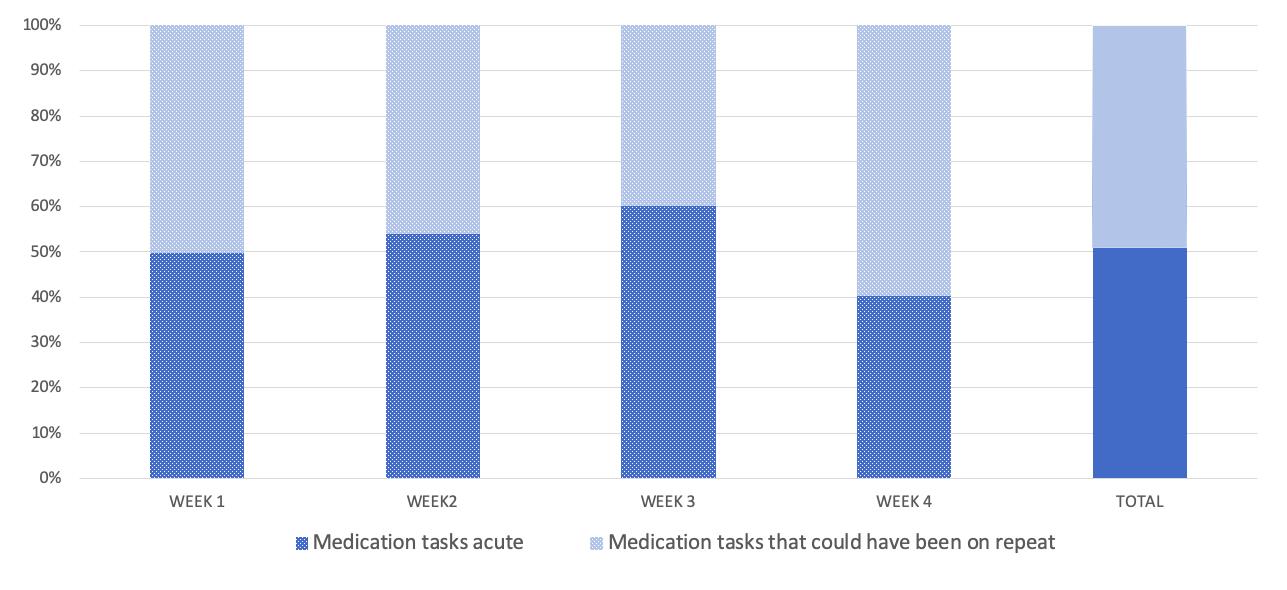
Focusing on the medication category, we had a look at whether medication requests sent to the on-call doctor were drug prescriptions that should have been on a repeat/variable repeat prescription rather than on acute. Out of a total 493 medication tasks for the month, 49.1% (n=242) medication requests could have been on repeat prescription rather than being acutely prescribed. A further analysis of this data yielded comparable findings per week. In the first week, there were 145 total medication tasks, about 50.3% (n=73) of drug prescriptions could have been on repeat. In the second week, out of 128 medications, 46.1% (n=59) of medication could have been on a repeat or variable repeat prescription. In the third week, out of 108 medications, 39.8% (n=43) of drug prescriptions could have been on a repeat or variable repeat prescription. In the fourth week, out of 112 medications, 59.8% (n=67) could have been on a variable repeat or repeat prescription. Table 1 represents the total number of medication tasks that could have been on repeat or variable repeat prescription per day. Figure 5 represents the percentage of medication tasks that were on acute prescription but could have been on repeat or variable repeat prescription across each week.
Table 1: Total medication tasks that could have been on repeat or variable repeat prescription, per day across each week for the four weeks of the month.
Figure 5: Percentage (%) of medication tasks that could have been on repeat or variable repeat prescription, across each week for the four weeks of the month.
DISCUSSION
SUMMARY
The total number of tasks did not differ significantly day-to-day: each day per week (Monday-Friday) held about 15-25% of the total weeks’ tasks. The medication requests contributed to the majority of the total tasks (50.9%); followed by requests for appointments, results and advice (35.9%). Upon further analysis of the medication category, 10-25 medication tasks per day could have been avoided by having certain drugs on repeat prescription rather than being acutely prescribed. Taking into account that a GP would typically spend 2 minutes per task, this could save 20-50 minutes per day, which amount to 100-250 minutes per week, and 400-1000 minutes or 6.5-16 hours per month.
The drug prescriptions that we thought should have been on repeat or variable repeat prescription, rather than on acute prescription, included requests for drugs that patients typically take long-term. This included Proton Pump Inhibitors (PPIs) such as Omeprazole, statins such as Simvastatin, and Angiotensin Converting Enzyme Inhibitors (ACEIs) such as Ramipril. These are for chronic conditions such as gastric reflux, hypercholesterolemia, and hypertension, respectively. Other drugs that we considered would be more feasible if put on repeat or variable repeat prescription were those for palliative patients in care homes that require a constant need for laxatives such as Senna or Lactulose, or drugs such as Paracetamol. These are for constipation or pain management, respectively.
The medication requests that could not have been on repeat or variable repeat prior to the request being sent were drugs that were required acutely, such as for short-lived infection, transient pain relief, changing of drug doses, and prescribing of alternative drugs due to a possible manufacturing problem or unavailability from the pharmacy. These are tasks that we deem necessary to be sent to the GP so that drug doses are changed based on clinical judgement, and not merely on a request sent to the receptionist. This upholds a standard of drug-control and patient safety within the practice.
STRENGTHS & LIMITATIONS
This retrospective study provides an in-depth analysis of the on-call doctors’ day-to-day tasks in terms of the nature and number of tasks. This is a study involving a large number of tasks collected from a month in a single GP surgery which has produced significant results. As non-GPs collected all the data, including data in the medication category, this eliminated bias in reporting acute medication that could have been prescribed as repeat or variable repeat medication. Limitations include the sample size being considered as a relatively small number which cannot be representative of all on-call GPs’ tasks in the rest of England. In addition, this study took place in the month of September and the tasks can be distinctly different when looking into other months.
COMPARISON WITH EXISTING LITERATURE
To date, the existing literature that looks at GP tasks from this perspective is limited. Most studies look at the receptionists’ role in handling patient requests or focus on scrutinizing the technology that GPs rely on to issue repeat or variable repeat prescriptions.
Our study included the number of tasks completed in a single month as well the stratification of tasks done within the month. We separated our results week per week to see if there were any differences between them. In 2014, a quantitative analysis of incoming calls into three GP surgeries described basic numbers of calls and type of patient enquiries that came into the practice. They had received a total of 2,780 calls and found that the most dominant type of request was making a doctor’s appointment. The main finding in the study is that it identifies an aspect of non-effective communication in GP receptionists’ encounters with patients. It describes how some receptionists failed to meet the initial requests of the patient by directing the telephone call forward or even closing calls prematurely before understanding the problem. This increased ‘patient burden’ and lead to lower patient satisfaction score when recorded. Effective receptionists understood and summarized the patients’ requests as well as making alternative actions to help the patients enquiry.7
Repeat prescriptions are defined as those that are printed by a practice computer from its repeat prescribing program8. In the UK, repeat prescriptions account for up to three quarters of all drugs prescribed, and four fifths of drug costs in General Practice.9,10 Repeat prescriptions are mostly done as a technology-supported practice that requires collaboration between clinical and administrative staff to ensure patient safety.11 Two conflicting opinions exist around repeat prescribing: the first is that the increased automation aids in improving safety; the second is that the process as a whole may be weakened if assumptions built into the technology do not take full account of the nature of healthcare work such as real life demands like time, space, and resource constraints.11,12 It is important that the GPs at our practice are aware of the risks involved in potentially putting more drugs onto repeat prescription, and consequently monitor this closely.
IMPLICATIONS FOR RESEARCH AND/OR PRACTICE
The findings collected in our study demonstrate the increasingly demanding role of the on-call GP outside of consultation hours. According to recent surveys, the GP occupation has had its lowest job satisfaction since 2001 because of a higher workload which indirectly lowers quality of patient care and increases negative patient experiences.13,14 This should be taken with paramount importance, as this can cause harm to both patients and GPs. As results have described the huge number of tasks, it is important to find a way to avoid unnecessary tasks telephoned into the GP surgery. The results of our study were presented to all of the staff in the practice and the underlying message was well received. Medications that are prescribed by the doctors are double checked by the Clinical Commissioning Group pharmacist in the practice to ensure that drugs are safely given to patients.
CONCLUSION
As the funding formula has changed in the last decade, the government budget into the NHS primary care has decreased more than in secondary care even with the ever-growing pressures on primary care services.13 Some strategies, such as telephone triage, have been introduced at the practice to reduce workload crisis. However recent evidence has shown this is not effective.15 In 2015, the primary care workforce commission laid out recommendations to restructure primary care services as the current model for primary care was under doubt. The underlying message in the report was that continuity of care was important for the majority of GPs - the GPs understood patients better when they had been under their care for many years.16 With this, extra tasks can be avoided if GPs know their patients well. At a glance of primary care, from literature and our findings, it seems that General Practice may follow an unsustainable path. The pressures of workload include increasing patient lists, higher public expectations and growing bureaucracy.17 Our data collection has proven that there are a lot of tasks to be done in a month by an on-call doctor, however the amount of time that could be saved by prescribing repeat or variable repeat rather than acute medication can save significant time. From our positive results in the medication task section, we hope this can inspire further research into other areas of the GP surgery that can help optimize the time of the doctors. Furthermore, we would like to repeat our retrospective study in one year’s time with the suggestion implemented (appropriate acute medications changed to repeat or variable repeat prescriptions) over a longer period of time. With limitations corrected for, we want to re-analyse the number and type of tasks completed to determine whether this has truly optimized the time of the overworked on-call doctor.
Temporomandibular joint disorder (TMD) refers to a broad spectrum of disease states characterised mainly by pain and tenderness in the temporomandibular joint (TMJ) and adjacent soft tissues, TMJ clicking and limitation in jaw movements. TMD symptoms vary in severity and if left untreated, may lead to debilitating pain and limited function with a significant impact on quality of life. The estimated prevalence of TMD is 2-6 % 1 although up to 25 % has also been reported. The aetiology of TMD is not fully understood and it is multifactorial including organic disease of the TMJ, trauma, malocclusion and stress. Treatment options include reassurance and education, physical and splint therapy, simple analgesia and other drugs, surgical intervention or combined treatment. Most cases of TMD can be managed non-surgically. Most patients with TMD have traditionally been initially managed by a GDP and are often referred to a specialist for further non-surgical or surgical therapies if symptoms are not controlled.
Andersen et al (1999) reported approximately 3 out of every 100 attendances to GMP services in Wales, UK were due to oral and dental problems 2. The number of people attending their GMP for dental problems has been increasing 3, 4. GMPs have expressed concerns about their ability to treat dental diseases 5 as these conditions are beyond the scope of their expertise.
Consulting GMPs for TMD has been observed dating back to over nearly six centuries 6. Similar to the rising trend of attending GMP for oral problems in general, there has been an increasing tendency for patients with TMD symptoms to approach their GMP as the first point of contact due to comparatively easier availability and financial feasibility. Prompt referral to a GDP or relevant speciality is likely to improve management and reduce the adverse impact on quality of life. This could potentially reduce the burden on overstretched NHS hospitals in UK. There is paucity of data on the management of TMD among GMPs in UK. To the best of our knowledge, there has been no prior survey of their knowledge of and attitude towards assessment and management of TMD. The objectives of this study are to assess the current experience of UK GMPs with the care of TMD patients in primary care.
Method:
Design
A Single-Centre Cross-sectional survey
Study population and survey development
GMPs listed within the Leicester City Clinical commissioning groups 7 with access to refer to the regional NHS Oral and Maxillofacial Services Providers. GMPs were formally invited to complete a specifically prepared postal questionnaire (See Appendix) consisting of their knowledge and management of TMD. In order to ensure the reliability and validity of the results of survey, the questionnaire was pretested on the GMPs in five different Urban GP surgeries other than Leicester city. To maximise response rates, a follow-up questionnaire and telephone calls were arranged after four weeks if no reply had been received. Confidentiality was maintained by number-coding the questionnaires. Selection bias was avoided by sending the questionnaire to all the GMPs in the Leicester city area.
The questionnaire Survey was conducted in February 2018 and comprised of 16 questions on TMD and two demographic questions .The questionnaire assessed knowledge of TMD including clinical features, diagnostic criteria, prevalence and aetiology. Participants were asked about awareness of current guidelines and treatment options, and their management practice, whether they would refer to a GDP, or oral and maxillofacial surgeon or TMD specialist. They were asked whether they update or have updated their knowledge about TMD. They were also invited to propose which means of TMD knowledge provision they would prefer to receive demographic data included information on the gender and clinical experience. There were no open-ended questions and participants were asked to select the most correct statement from more than one option in some of the questions. Participant GMPs were informed in the invitation letter that participation was voluntary, all responses were anonymous and that the study would be published in a peer-reviewed journal. Participation in the survey implied consent.
Data analysis
Data was analysed descriptively using IBM SPSS Statistics for Windows version 21 (IBM Corp, Armonk, USA). We aimed to determine whether there is any relationship between GMPs knowledge of diagnostic features of TMD and their length of experience in practice. We stratified GMPs into two groups according to the seniority [certificate of completion of specialist training (CCST) obtained within 5 years or earlier]. Chi square test was used to compare the proportion between two groups and a p value < 0.05 was considered to be statistically significant.
Results:
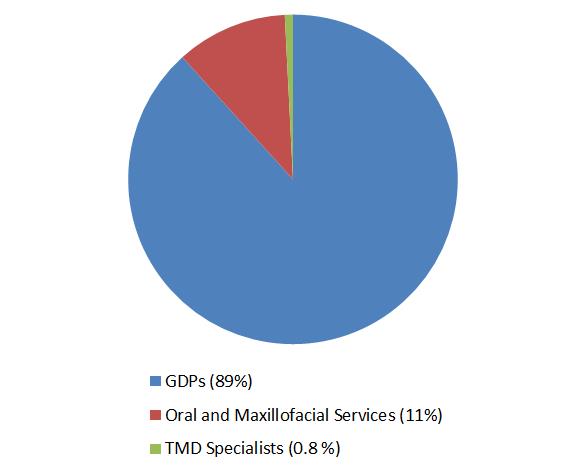
Out of 259 GMPs who were contacted and invited to participate, a total of 126 practitioners returned the questionnaire by post {response rate (48.6%)}. Of the respondents, 2 did not correctly fill the survey questionnaire; the remaining 124 responses were analysed. There was a slight male preponderance (55%). Only 12% GMPs rated themselves above average (score >4) in terms of being familiar in general with TMD. Five percent of responders were aware of published guidelines of TMD management. None of them were familiar of Research Diagnostic Criteria for Temporomandibular Disorders (RDC/TMD). Seventy-four percent of participants, including both GMPs with experience less than 5 years and more described the clinical features consistent with the diagnosis of TMD. 4% selected the correct option when asked about the possible causative factors. None of them knew about the actual prevalence of TMD symptoms in the community and majority of GMPs underestimated the proportion of population with TMD. Fourteen percent were correct in identifying the age group affected by TMD. While majority of them (56%) chose ‘ No’ and 12 % of them selected ‘Don’t know’ , thirty-two percent, participants believed that subjects with TMD symptoms require initial radiographic assessment before any treatment is commenced. 95% of respondents believed that they have seen on average 2 to 4 TMD patients per month. Eighty nine percent of respondents referred patients to GDPs whereas remaining 11 % of GMPs contacted Oral and maxillofacial surgery service providers for TMD management (see Figure). Only one of the participants was familiar of specialist-clinical services for TMD who, in addition to sending these patients to GDPs, also referred TMD patients directly to specialists. Majority of them (66%) were not comfortable in seeing and provide initial management of TMD and 34% of GMPs, in addition to referring TMD patients to other services, also provided initial treatment to these patients. All those who offered this initial non-surgical treatment to manage TMD, selected combined modalities i.e. patient education, pharmacological and physical therapy. In every 25 participants (6%) has updated their knowledge through internet resources in order to increase their awareness and knowledge about the TMD management in community. Almost all (97%) of the GMPs would welcome relevant continued education programmes and receiving leaflets / published literature. The summary of GMPs responses from survey is given in Table 1. Group analysis of participants (See Table 2) did not show any statistical association between the experience of GMPs and their knowledge of TMD clinical features (Chi-square statistics 3.78, p = 0.5).
Figure: GMPs Referral for TMD patients GMPs: General Medical practitioners, TMD: Temporomandibular joint disorders, GDPs: General Dental Practitioners
Table 1: Summary of the main responses from the GMPs survey about TMD knowledge
Familiarity of TMD rated as above average
12%
Awareness about TMD guidelines
5%
Familiarity with RDC Criteria of TMD
0%
Correctly identified the etiological factors of TMD
4%
Correctly identified TMD clinical features
74%
Correctly identified the TMD prevalence in General population
0%
Correctly identified the age group suffered most with TMD
14%
Selected ‘No’ about the need of radiograph before TMD management is initiated
56%
Not comfortable in seeing and provide initial management of TMD
66%
Selected combination of pharmacological and physiotherapy to treat TMD
34%
Have referred TMD patients to GDPs
89%
Have referred TMD patients to Oral and maxillofacial surgery
11%
Have updated the TMD knowledge through any resource
6%
Keen to receive further information about TMD
97%
GMPs: General Medical practitioners, TMD: Temporomandibular joint disorders
Table 2: Distribution of participant GMPs according to their seniority and familiarity with TMD clinical features
Experience as GMP
Correctly identified TMD features (n)
Incorrectly identified TMD features (n)
Greater than 5 years
50
11
Less than 5 years
42
21
Chi-square statistics 3.7894 p = 0.5 GMPs: General Medical Practitioners, TMD: Temporomandibular joint disorders
Discussion:
Main Findings
Our study is the first which has explored in-depth the experience of GMP with TMD management. Findings from the survey indicate that uncertainty exists among GMPs regarding their level of knowledge. Most GMPs had no awareness of TMD management guidelines. The RDC/TMD 8 is a valuable tool to assess signs and symptoms and to classify patients with TMDs. Participants were not aware of these guidelines. The response from GMPs indicated that the prevalence of TMD within the general population is not accurately recognised at all along. The majority of respondents do not appreciate that TMD patients require radiographic evaluation before treatment planning. None but one of the GMPs was aware of clinicians with a subspecialty in TMD. All patients with such condition were referred either to dentists or maxillofacial surgeons. This reflects an awareness of an appropriate chain of referral 9. There was a generalised consensus in considering the general medical practice environment as an unsuitable place to manage dental problems 5, including TMD. A positive finding of our study was that a significant proportion of GMPs in Leicester city are interested in learning about TMD. This indicates there is a need for designing formal training courses for GMPs. If appropriately trained, these practitioners will potentially have an enhanced capability of not only managing TMD at an initial level but also providing knowledge and guidance to other practices and community services
Comparison with existing literature
The knowledge, attitude and practices of GDPs regarding TMD management are widely reported 10-12 but there is hardly any study relating to General Medical Practice. Results of a questionnaire survey based on screening of TMD in 38 London teaching General Medical Practices were similar to our findings 13. .Thirty-six of 38 GMPs, who replied in that survey, routinely assess the TMJ as part of the physical examination for symptoms of TMD whereas TMJ assessment was not included in primary health care screening. Similarly to Cope et al 2015 5 another qualitative study in the North-west of England GMPs experiences of chronic orofacial pain, including TMD, revealed primary health care providers consider themselves unable to meet the diagnostic and management challenges of TMD 14 .GMPs in the face to face interviews explained that despite these limitations, they do offer TMD patients pharmacological and other complimentary approaches, particularly acupuncture. Similar experiences of GMPs are also reflected in our current findings.
Strength and limitations
The main strength of this survey is that, to the best of the authors' knowledge, it was the first study which determined Knowledge and experience of GMPs towards Management of TMD. In simple language but a comprehensive and pilot tested questionnaire was designed to assess GMPs knowledge of TMD which they were expected to have gained from available literature.
There were mainly two limitations in our survey. Firstly, the sample size was small as the study was confined only to the participant GMPs practising in Leicester City, hence it may not be representative of all GMPs across the country. Despite this weakness the results may serve as a scoping study to justify further research such as qualitative surveys. Secondly, there was a relatively low but acceptable response rate (48.6%). Although this raises concerns about the research validity, but studies have demonstrated that there is no direct correlation between response rate and validity 15. Also, Surveys with comparatively low response are only marginally less accurate than those with much higher reported response rates 16.
Implications for research and practice
In addition to other main areas of practice, the Royal College of General Practitioners (RCGP) curriculum also highlights the importance of Specialist GMP trainees attaining competency in learning about common oral and maxillofacial conditions 17. Considering the frequent attendance of patients with oral and facial diseases in primary care and the limited undergraduate Medical training, valuable suggestions have been made for GMPs to promote attendance at specialist oral medicine and oral surgery clinics to enhance exposure to common maxillofacial diseases. Despite these recommendations, surprisingly little no active interest has yet been shown by GMPs trainees. There is a need to integrate GMP training with some exposure to the specialty of Oral and Maxillofacial surgery to improve expertise in the management of TMD and other oral diseases, especially in view of the increasing trend for patients to initially present to their GMP for advice about TMD and other chronic orofacial pain conditions. .
Evidence based literature regarding dealing with TMD at a non-specialist level have been published in the medical literature 18-20. This provides clinicians including GMPs with sufficient knowledge to diagnose and refer TMD to the relevant clinician. The British association of Oral and Maxillofacial Surgeons (BAOMS) TMD commissioning guide 2014 8 suggests GMPs to refer TMD patients to a GDP in the first instance to start initial treatment. Early diagnosis, counselling and management of TMD tend to improve prognosis and reduces the severity of impact on the quality of life 21, 22. It is crucial that GMPs are have sufficient knowledge to make an early referral to an appropriate clinician in order to commence conservative measures including education and advice, use of a bite guard, medications and self-directed physical therapy. The limited access to dental care within the UK, despite a National Health Service (NHS), is a well-recognised challenge. There are multiple barriers to accessing dental care 23 including delays or failure in getting appointments which results in the patient turning to General Medical Practice for advice 4. GMPs have also expressed concerns regarding accessibility to and the collegiate relationship with GDPs in the management of chronic facial pain including TMD 14. Whether the aforementioned limitations are system related or simply patient factors, they are certainly hindrances to timely assessment and intervention. We suggest that suitably trained GMPs should be able to commence the initial conservative management of TMD patients whilst simultaneously referring patients to a GDP or appropriate specialist so as to optimize the management and possibly reduce subsequent referrals in the long term. There is an immense potential for primary care to be integral part of initial management of TMD. A large scale nationwide study could potentially help future planning for care within the community.
Conclusion:
Respondent GMPs in East midlands England, demonstrated limited knowledge and confidence related to the diagnosis and management of TMD. Appropriate post-graduate training and educational opportunities for ongoing continuing professional development related activities would improve the knowledge and awareness of TMD management, potentially leading to more effective care within the community.
In a contemporary medical practice caring for complex patients with utmost efficiency, primary care physicians and specialists are expected to work together to organize a seamless transfer from acute to chronic care. The job of the generalist is to sort out and integrate different recommendations from numerous specialists and apply those strategies in the care of the patient long after the index admission. During such interactions with specialists, primary care physicians often realize the impact of differing viewpoints on the overall patient care well beyond the anticipated time frame, whether acute or chronic. To that end, and to better inform such recommendations, this paper proposes the top 10 things primary care physicians wish every specialist knew when addressing problems on the busy hospital ward.
1. Organ-systems work together, not independently
As we see in examples such as the cardio-renal syndrome, hepato-renal syndrome, or hepato-pulmonary syndrome, as the patient gets sicker, the interaction of organ-systems begins to dominate. Indeed, predicting the outcome in comorbid conditions depends not only on understanding the culprit organ, but rather quantifying a complicated interaction of multiple organ-systems. For example, the ADHERE registry algorithm shows the most important predictor for in-hospital death in heart failure patients is not the cardiac function per se, but rather creatinine clearance and BUN[1]. In other words, the commonly used comments from a specialist asked to evaluate their system of expertise, ‘such and such organ is fine’, might soon become irrelevant and obsolete in the context of multiple complex systems.
Moreover, recent research revealed that genotype, endotype and phenotype are quite different in COPD and asthma[2]. Therefore, even though a disease may manifest in a single system, the pathophysiological process from which it arose may have been triggered in different organs.
2. Mortality is not the only outcome measure
Specialists seem to treat all-cause mortality as the most important outcome measure in most cases. Or, they choose strategies based on organ specific survival as an alternative, such as MACE (major adverse cardiac events) or creatinine-doubling time[3]. Life is far more than just being alive. Subsequently, the quality of life (QOL) measures, which capture patient-centred outcomes, provide insight into the effectiveness of interventions but also their meaningfulness to patients, and such measures are gauging previously uncaptured positive aspects of interventions[4]. The difficulty of defining well-being remains a challenge for researchers and arises from the differences brought about by cultural and societal elements which are context-bound and unique to each community.
3. ADL is one of the most critical prognostic indicators
New biological markers are numerous around here - new renal injury markers, such as NGAL or KIM, to name a few. But a quick, old-fashioned, bedside assessment can easily reveal impairments in Activities of Daily Living (ADL) at each patient visit; and ADLs by Functional Assessment Measures have been consistently shown as strong outcome predictors in acute and chronic illnesses, especially within elderly populations[5]. In fact, functional measures were deemed to be as important as other objective measures in some prognoses[6]; for instance, in the BODE score for COPD survival prediction, the ADL measure carries the same weight as the PFT (Pulmonary Function Test). In the management of elderly patients, hospitalization[7] and initiation of haemodialysis[8] significantly influence the worsening of ADLs. In the development of a 1-year mortality index after hospital admissions among elderly patients, ADL was of pivotal importance[9].
Functional impairment is also a strong indicator for readmission: there is a dose-response correlation of severity of impairment and the risk of readmissions[10]. Intensifying the in-hospital post-ICU physical and nutritional therapy has been shown to improve many aspects of recovery[11]. In patients with numerous chronic illnesses, the number of comorbidities strongly correlates with the decline of ADL[12]. Interventions to maintain pre-hospitalization ADL is important in facilitating recovery from hospitalization, and in one study in-hospital mobility programs helped patients to maintain pre-hospitalization ADL while the usual care group experienced significant decline[13].
4. Effectiveness, not efficacy, matters most in the real-world
“Doctor, I cannot afford the medicine prescribed to me when I was discharged!” This is oft-repeated in offices of generalist physicians. If a patient cannot afford medication and therefore does not take it, the treatment lacks efficacy. In the inpatient setting, efficacy of intervention determines the outcome since patients are most likely to receive the prescribed intervention. This is not the case in the outpatient setting, and the effectiveness of an intervention depends on many other elements, such as the accuracy of diagnosis, patient compliance to the proven intervention, prescription drug coverage, access to care, and finally, efficacy of the intervention[14].
5. Mental wellness is essential to physical wellness
Health is not limited to the physical body; it also involves mental wellness. In fact, mental and physical health are inseparable. Naturally, serious illnesses affect mood and cognition: therefore, it is important to acknowledge that mental health issues lie squarely within the spectrum of physical disease management. Generalists can help patients with multiple comorbidities manage depressive symptoms through brief psychological interventions; such symptoms related to cognition and mood are expected consequences of any serious illnesses.
Studies have shown that among elderly patients without dementia at baseline, noncritical hospitalization is associated with the development of cognitive dysfunction[15]. Among elderly patients, the prevalence of cognitive dysfunction is significantly higher in ADHF (acute decompensated heart failure) admissions[16] or survivors of severe sepsis[17]. Depression and depressed mood are prevalent in patients suffering serious illnesses[18]. New models are emerging to integrate psychotherapy in multiple comorbid patients and have been proven to be effective[19].
6. Pay heed to illness trajectory
“My grandma has never been the same after her hip surgery. Please fix her!”
Primary care physicians often note a decline in the general function and cognition of their patients after index admissions to the hospital. As noted earlier, acute hospital admissions have a strong independent effect on the severity of disability amongst elderly persons[20]. The multidimensional frailty score, which incorporates ADL and cognitive function, predicts one-year mortality based on a simple scoring system[21]. Poor functional status attributes to frailty and has led to poor surgical outcomes in the elderly[22]. The prevalence of functional impairment steadily increases from 28% in the 2 years prior to death to 56% in the last month of life[23]. Studies demonstrate that gait speed is an important predictor for survival amongst the elderly[24][25] as well as grip strength[26][27].
Furthermore, elderly patients sustain significant impairments long after the index hospitalization[28]. Amongst elderly patients discharged from the ICU, more than 50% die within a month[29]. At one-year follow-up, critical ADL capacity, such as taking medications or shopping, was impaired in more than 70% of ICU survivors who remained ventilated for longer than 48 hours[30]. Delirium sustains a long-lasting effect even after patients are discharged from the hospital, the longer the duration of delirium, the more sustained is the cognitive impairment[31].
7. Care for the care-givers
There is increasing evidence that caregivers sustain long lasting effects from patient illnesses. Depressive symptoms increase overall for surviving spouses regardless of hospice use[32]. The RECOVER study[33] demonstrated that caregivers suffered from high levels of depressive symptoms up to 1 year after a loved one’s ICU admission. In the era of chronic illnesses, it is essential to be mindful of the contributions made by caregivers in disease management. Tools are widely available for the clinician to assess caregiver burden[34]. This is important because family-support interventions have been shown to improve the quality of communication and decrease the patient’s length of stay in ICU[35].
8. ‘Exercise and diet’ trumps ‘medicine and surgery’
The COURAGE trial demonstrated that after 7 years, there is no difference between medical management and percutaneous intervention (PCI) in managing coronary disease[36]. As time progresses after the initial event, the benefits of surgical intervention become less apparent. Similarly, in the long run, intensive statin therapy has not proven to be of greater clinical significance compared to those receiving moderate levels of statin[37]. As the saying goes, in the long run, “we are what we eat.” Innumerable studies have shown that diet and physical habits have a lasting effect on the health of individuals[38]. Bariatric surgery has been demonstrating dramatic and long-lasting effects on diabetes control, while the DiRECT study demonstrated that intensive exercise and diet successfully achieved remission in nearly half of the intervention group, compared to only 4% of controls[39]. Despite the substantial increase in chronic illnesses that are closely tied to our lifestyle and eating habits, physicians of all specialties are poorly trained to provide nutritional counselling to patients[40].
9. Whose definition of health matters?
If health is defined, as defined by the WHO, is not simply the lack of illness, but “a state of complete physical, mental and social well-being,” it must incorporate many other elements dictated by societal, cultural, moral and philosophical norms and values. Furthermore, the definition of health and the path to attain it should come from the society and community it reflects, since neither healthcare personnel nor the healthcare industry own health. Therefore, the definition should emerge from community interventions and multidisciplinary groups filled with varied stakeholders, rather than from the ivory tower of healthcare researchers. Therefore, medical decision-making processes are rapidly moving away from the paternalistic approach to consensus-based, collegial decisions. Shared decision-making, informed consent, discussions of different treatment options and acquiring second opinions have become standard practice and reflect the empowerment of patients, and communities, to define their own healthcare. Ultimately, as long as patients are competent, they decide their treatment after consulting with physicians, who advocate for the patients’ goals in care and advise them accordingly.
10. Empower healthcare recipients
In the long-term management of chronic illness, participation of the patient is essential. And transparent communication is pivotal for better participation and shared decision-making[41]. In the new model of health, healthcare providers must play an active role in advocating for patients and promoting well-being while acknowledging that health is a dynamic concept[42]; these physicians do not simply “coordinate care.” This shift from the physician-centred to the patient-centred approach, in and of itself, will be empowering for patients.
CONCLUSION
Transition of care is one of the most important steps connecting hospital care to primary care. Those problems currently labelled as miscommunication might be more than just a lack of handoff tools or timely messaging; they rather stem from a difference in priorities and varied interpretations of patients’ problems by these two groups of providers. Many questions remain unanswered when facing the future of collaborative healthcare: what kind of doctors are most suited to address the complex interaction of illnesses involving multiple organs? Who can develop a new framework to capture this dynamic and complex interaction of systems, covering many organs in a single patient? Moreover, the next generation of healthcare providers will need to be trained to bear in mind this fundamental concept of patient management. As the twenty-first century progresses, discoveries within medical science will continue to advance the field further away from the current organ-based specialization to pathophysiology-based specialization. This article advances the discussion on the altering role of generalist physicians and the advice of their specialist colleagues, as together they face more and more changes within the practice of medicine.
Telephone triage has been used by many practices in primary care to manage workload and prioritise patients for same day appointments.1,2 Telephone triage may have benefits in terms of managing work load,3 but is also associated with certain risks,4 which has worried both clinicians and patients.5 The analysis of the use of telephone triage has so far focused on the ease of access, demand management, cost effectiveness, quality of consultations, safety and patient satisfaction. However, other effects in terms of patient outcome may exist. One of the main focuses in General Practice is to identify symptoms and signs of cancer for early diagnosis to improve outcome. Our study aims to assess whether telephone triage helps in prioritising early assessment and referral of patients who are subsequently diagnosed with cancer.
Methods
A retrospective analysis of all the patients at our practice who had a diagnosis of cancer made between April 2013 and December 2014 was carried out.
Patients have a choice of 2 different ways to book an appointment in our practice.
Telephone triage for same day appointment requests, where a triaging doctor decides about the urgency of a problem and books the appointment, arranges tests or gives advice after speaking to patients over the phone. This group is referred as “Group 1” in this study.
Patients book the next available appointment to see a GP through reception without any triage. This group is referred to as “Group 2” in this study.
The date of first contact with the GP practice for the symptoms which later lead to a diagnosis of cancer was noted for both groups. This was the telephone triage date for the first group and the date the appointment was booked by the patients for the second group. The date the patient was first seen in secondary care for further assessment and investigations was also noted. The duration between first contact with GP practice and GP appointment, and the duration between the first contact with practice and first hospital appointment were calculated. This information was gathered from practice computer records.
Patients who were diagnosed with cancer through screening were excluded. Slow growing tumours which do not merit a 2-week rule referral, such as basal cell cancer of skin were excluded. Patients whose appointments were initiated by the GP on reviewing the results of routine tests were not included. Patients diagnosed with cancer in hospital without going through primary care referral were also excluded from this study.
There are two research questions:
Is there a significant difference in the time required from the first contact with primary care to the GP Clinic appointment between Group 1 and Group 2 patients?
Is there a significant difference in the time required from the first contact with primary care to the date the patient was seen in the secondary care between Group 1 and Group 2 patients?
Descriptive statistics (such as the mean, standard deviation, median, minimum, and maximum) were used to present the time required from the first contact with primary care to the GP Clinic appointment; and the time required from the first contact with primary care to the date patient seen in the hospital, for Group 1 and Group 2 patients. Wilcoxon rank-sum test was used to answer each research question. A p-value less than 0.05 indicated significance at the 0.05 level.
All data analyses were conducted using SAS.
Results
A total number of 39 patients were included in the study. Among them, 13 (33%) used telephone triage to make their appointments and 26 (67%) booked their appointment by themselves.
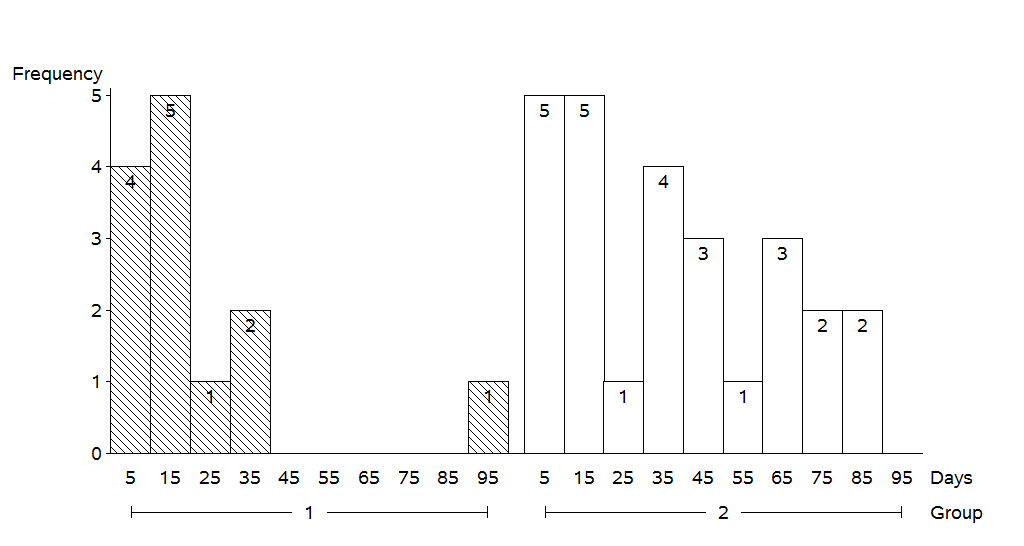
Figure 1 shows the bar charts of the time required from the first contact to GP practice, to the GP clinic appointment for Group 1 and Group 2 patients. It took 0-3 days for 12 Group 1 patients and 8-11 days for 1 Group 1 patient. The time required from the first contact to GP practice to the GP Clinic appointment for Group 2 patients can be illustrated by the same manner.
Figure 1: Bar charts of the time (days) required from the first contact for surgery to the GP Clinic appointment for Group 1 and Group 2 patients. (Note that the midpoints 2, 6, 10, 14, 18, and 22 represented days within the range of 0-3, 4-7, 8-11, 12-15, 16-19, and 20-23, respectively.)
Table 1 shows the summary statistics for the time (days) required from the first contact with the practice, to the GP Clinic appointment for Group 1 and Group 2 patients. The average time required was 0.77 days for Group 1 patients and the average time required for Group 2 patients was 7.88 days. The results of Wilcoxon rank-sum test indicated that this was a statistically significant difference in time required from the first contact for surgery to the GP Clinic appointment between Group 1 patients (patients using Telephone triage to make their appointments) and Group 2 patients (patients booking their appointment by themselves) (p = 0.0020).
Number
Mean
SD
Median
Min
Max
Group 1
13
0.77
2.24
0
0
8
Group 2
26
7.88
7.53
6
0
23
Table 1:Summary statistics for the time (days) required from the first contact for surgery to the GP Clinic appointment for Group 1 and Group 2 patients. SD = standard deviation.
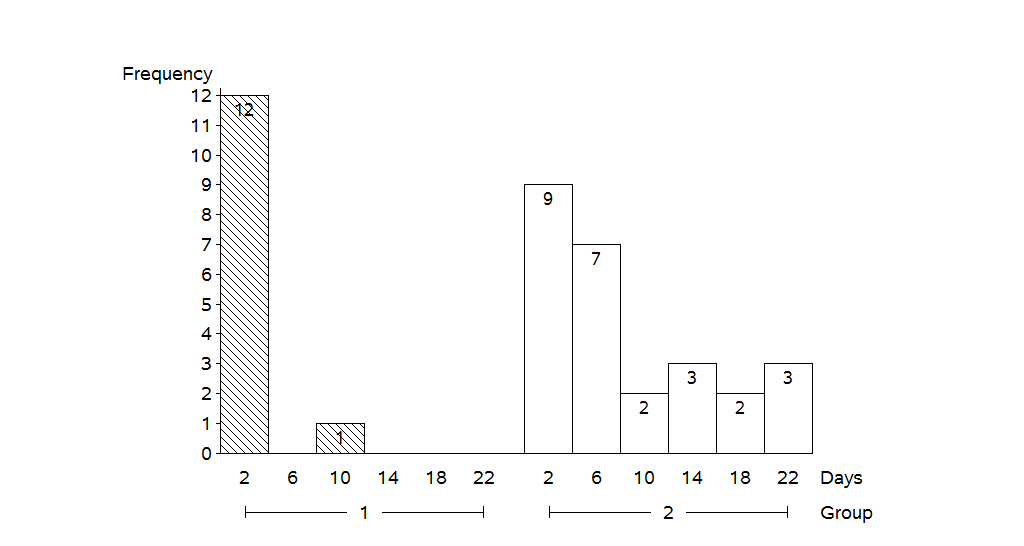
Figure 2 shows the bar charts of the time required from the first contact with the GP practice, to the date patients were seen in the secondary care for Group 1 and Group 2 patients. It took 0-5 days for 4 Group 1 patients, 10-19 days for 5 Group 1 patients, 20-29 days for 1 Group 1 patient, 30-39 days for 2 Group 1 patients, and 90-99 days for 1 Group 1 patient. The time required from the first primary care contact to the date patient seen in the secondary care for Group 2 patients can be illustrated by the same manner.
Figure 2: the bar charts of the time required from the first contact for surgery to the date patient seen in the hospital for Group 1 and Group 2 patients. (Note that the midpoints 5, 15, 25, 35, 45, 55, 65, 75, 85 and 95 represented days within the range of 0-9, 10-19, 20-29, 30-39, 40-49, 50-59, 60-69, 70-79, 80-89 and 90-99, respectively).
Table 2 shows the summary statistics for the time (days) required from first contact with GP practice to the date patients were seen in the hospital for Group 1 and Group 2 patients. The average time required for Group 1 patients was 19.54 days and the average time required for Group 2 patients was 35.69 days. The results of Wilcoxon rank-sum test indicated that this was a statistically significant difference in time required from the first contact to the primary care to the date patient seen in the hospital between Group 1 patients (patients using Telephone triage to make their appointments) and Group 2 patients (patients booking their appointment by themselves) (p = 0.0474).
Number
Mean
SD
Median
Min
Max
Group 1
13
19.54
23.41
10.00
3
90
Group 2
26
35.69
26.28
32.50
1
88
Table 2: Summary statistics for the time (days) required from the first contact for surgery to the date patient seen in the hospital for Group 1 and Group 2 patients. SD = standard deviation.
Type of Cancer
Number of Patients
Lung
5
Breast
5
Colorectal
4
Malignant melanoma of Skin
3
Squamous Cell carcinoma of Skin
3
Oesophagous
2
Stomach
2
Urinary Bladder
2
Larynx
2
Pancreas
1
Endomtrium
1
Cervix
1
Kidney
1
Prostate
1
Testis
1
Tonsil
1
Lymphoma
1
Appendix
1
Myelodysplastic
1
Olfactory Neuroblastoma
1
Table 3: Number of patients with types of cancer.
Discussion
More than 90% of contacts with healthcare in the UK occur in primary care.6 The estimated numbers of consultation for a typical practice in England rose from 21,100 in 1995 to 34,200 in 2008 as per analysis conducted by Hippisley-Cox J et al.7 With increasing demands being placed upon General Practice, there is a need to explore innovative ways of working which enable the prioritisation of patients with concerning symptoms. Telephone triage has been considered to reduce the demand for face-to-face consultation with GPs,3 which can potentially free up time for effective use. NHS England report ‘Transforming Urgent and Emergency Care Service in England’ suggests GPs should offer more telephone consultations to reduce pressure on accident and emergency.8 However, a cluster-randomised controlled trial (The Esteem Trial) across 42 practices showed that telephone triage increased the number of primary care contacts in the following 28 days, after patients’ request for same day GP consultation.1
With increasing demands for consultations, it is important to have a system to identify and prioritise patients for early assessment; who may have a suspected cancer diagnosis. Our study demonstrates that telephone triage reduces the time from first primary care contact to face to face assessment in primary and secondary care for patients with suspected cancer. Patient numbers are small and the sample is from one practice, yet the difference seen is statistically significant.
Cancer stage at diagnosis is one of the major reasons for difference in cancer survival in different countries.9,10 The delay in cancer diagnosis can be due to multiple factors. Telephone triage can provide an opportunity to patients to discuss symptoms early with a GP, and this can reduce delays in the cancer diagnosis pathway. It has been shown that certain alarm symptoms are associated with the likelihood of cancer diagnosis 11 and these can be used to prioritise the patients in triage process. It may also reduce anxiety amongst patients waiting for an appointment, who are concerned about their symptoms.
Telephone triage should not only be seen as a way of managing demands and appointments but also as a system to improve patient outcome. Further research is clearly needed on a larger scale to determine if the results are reproducible in other settings as patients’ knowledge and understanding about cancer warning symptoms and healthcare seeking behaviour may vary among different population sets.
Oestrogen receptors (ERs) are expressed in a large proportion (approximately 70%1) of breast cancers (BCs). Oestrogen stimulates the growth of breast epithelial cells (both normal and cancerous) by binding to these receptors. Aromatase inhibitors (AIs) prevent the conversion of androstenedione to oestrogen by the enzyme aromatase in peripheral tissues, which is the predominant source of oestrogen in post-menopausal women. Consequently, they are routinely offered to post-menopausal women with ER-positive early invasive breast cancer as adjuvant therapy2. However, decreased residual oestrogen levels are associated with increased bone resorption by osteoclasts. The menopause initiates an accelerated phase of bone loss lasting 4 to 8 years, which is followed by a slower phase which continues indefinitely3. AI-induced bone loss (AIBL) occurs at a higher rate than natural menopausal bone loss4. Women are therefore at increased risk of fractures while they are on AI therapy5, with an associated higher rate of fractures as demonstrated in the ATAC trial6.
Recent data have supported more prolonged use of AIs (10 years instead of 5) to achieve lower BC recurrence rates7. This may lead to changes in future clinical practice in that ER-positive BC patients may be on an even longer course of AIs. This is likely to translate into a higher fracture risk in patients on long term treatment, and bone health in these patients should remain an important consideration.
Several guidelines have emerged over the years, as summarised by Hadji et al8, to aid the assessment of fracture risk in women receiving BC treatment, and management of AIBL. In the UK, the guidance in use and recommended by the National Institute of Health and Clinical Excellence (NICE) is a UK expert group consensus position statement issued in 2008 (Guidance for the Management of Breast Cancer Treatment-Induced Bone Loss)9. This includes two treatment algorithms for the assessment and management of bone loss in early BC: one for women with adjuvant treatment-induced premature menopause and the other for postmenopausal women starting adjuvant AI.
Despite the existence of various guidelines on the management of AIBL in BC patients, few articles have been published on the practical adherence to guidance. We carried out an audit of the management of AIBL in BC patients in a large general practice (with roughly 9000 registered patients) in Bradford (UK). Given the small number of eligible patients in our study, we undertook a review to identify all studies in the English literature assessing practical adherence to guidance on AIBL to establish whether gaps identified in our practice reflects a more widespread issue.
Our study
Methods
We carried out a retrospective study in a general practice in April 2015. Using the clinical electronic system used at the practice (SystemOne), we performed a search for all registered patients documented to currently be on AIs or to have previously been on them at any point, for the treatment of BC, using the search terms “anastrazole”, “Arimidex”, “exemestane”, “Aromasin”, “letrozole” and “Femara”. We excluded male patients (not addressed by current guidelines) and patients who started their treatment with AIs prior to the issuance of the UK guidance in 2008. For each patient we gathered data on the indication of treatment, menopause status, the date of initiation +/- completion of treatment, details of dual energy Xray absorptiometry (DEXA) scan and bone mass density (BMD), blood biochemistry results, documented risk factors for fractures and details of bone protection treatment. We audited our practice against the UK guidance.
Summary of the UK guidance
All post-menopausal patients starting AIs should have a baseline DEXA within 6 months of treatment initiation. Patients are stratified as low, medium and high risk for fractures based on the baseline T-scores. Medium and high risk patients should have vitamin D and calcium supplements, and high risk patients should be started bisphosphonates. A repeat DEXA scan should be performed 2 years later for medium and high risk patients to re-assess BMD and augment bone protection therapy as appropriate. Patients aged 75 years and above with at least one clinical risk factor for fractures should be started on a bisphosphonate regardless of their baseline BMD.
Results
There were 12 female patients who started AIs for BC treatment from 2008 onwards. Treatment was initiated between the years 2008 and 2014 (inclusive). The mean age was 67 years (range 57-81 years) and all 12 were post-menopausal at the time of adjuvant hormonal therapy initiation. Three were initially on tamoxifen and switched to an AI after 2 years of tamoxifen therapy.
Three patients (25%) did not receive an initial DEXA scan and had no subsequent risk fracture management. One of them was 75 years of age at the time of AI initiation and was on long term steroids (i.e. should have been on a bisphosphonate regardless of BMD), but she was not on a bisphosphonate.
Of the remaining 9 (75%) who did have a DEXA scan,
One was at high risk (T-score -2.7), and was appropriately started on a bisphosphonate and calcium and vitamin D supplements.
7 patients were at medium risk of osteoporotic fractures (T-score range -2.0 to -0.1). All were started on calcium and vitamin D supplements.
7 were eligible to have had a repeat DEXA scan at the time of the study but only 4 had a scan. Of these four, one was found to have incurred significant bone loss and was started on a bisphosphonate.
The mean interval between AI initiation and baseline DEXA was 1.9 months (range 0.2-4.4). The mean interval between the initial and repeat DEXA scans was 4.1 years (range 2.5-5.1).
Figure 1 illustrates the proportion of scans requested by different clinical teams involved in the patients’ care.
Figure 1: Who requests DEXA scans?
Literature review
Methods
We performed a search with the following terms on the Ovid Medline and Embase databases: “bone loss”, “osteoporosis”, “osteopenia”, “aromatase inhibitor”, “breast cancer”, “guidelines” and “guidance”. Of the 137 results returned after deduplication, we selected original and review articles assessing management of AIBL against established guidelines. We retrieved further papers by reviewing the references of these articles.
Results
The original articles generated are shown in Table 1. While conference abstracts have not been included here, they have been reviewed for the purpose of our discussion.
Table 1: Original articles publishing the results of audits of bone health management in BC patients on AIs against established guidelines
Authors
Place of study
Guidelines used to define audit standards
Sample size
Adjuvant therapy
Roberts R et al10
Australia
ASCO*, ESMO*, Hadji et al8, Belgian Bone Club
42
Both AI and tamoxifen
Spangler L et al11
Washington, USA
ASCO*
342
AI
Bosco D12
Italy
Results from the ARBI* trial13
39
AI
Gibson K et al14
Colorado, USA
ASCO*
54
AI
Ligibel et al15
USA
ASCO*, NCCN*, Hadji et al8
9138
AI
Dong et al16
UK
NICE guidelines based on UK expert group consensus9
100
AI
Zekri J et al17
Saudi Arabia
NICE guidelines based on UK expert group consensus9
367
AI
*ASCO: American Society of Clinical Oncology, ESMO: European Society for Medical Oncology, NCCN: National Comprehensive Cancer Network, ARBI: Arimidex Bone Mass Index and Oral Bisphosphonates
Discussion
The results of our audit show that we are failing to meet our current national standards pertaining to management of AIBL in BC patients. Our literature review confirms that this is a widespread issue and that results from larger studies are in agreement with ours.
25% of our patients never had a baseline BMD measurement. Similar findings have been reported in the literature11,12,14. However, Roberts et al report much higher rates of DEXA screening pre –AI10. Reasons for this were felt to be the presence of an institutional treatment algorithm as well as a survivorship programme.
We had a poor rate of repeat DEXA scans. Gibson et al and Spangler et al also noted that the highest rate of DEXA scanning was around the time of AI initiation compared to after initiation of therapy11,14. For the patients who had a repeat BMD measurement in our study, practice was not in line with recommendations as the interval between the initial and repeat DEXA scans (mean 4.1 years) was much longer than the recommended 2 years. This may be because recommendations made by the breast surgery team were different (intervals of 3 to 5 years being recommended in some cases in clinic letters written to the GP by the breast team).
Gibson et al found that 75% of their patients were on calcium and vitamin D, which deviates from the ASCO guidelines that they audited their results against14. The ASCO guidelines recommend that all BC patients should be on calcium and vitamin D therapy. In some studies10.12 not all women diagnosed with osteoporosis were started on bisphosphonates. Although women diagnosed with osteoporosis were started on bisphosphonates in our cohort, the suboptimal uptake of DEXA scans means that we may have missed the diagnosis in a number of patients.
From the articles included in our literature review, several reasons have been suggested as causes for deviation from guidelines when it comes to management of AIBL in BC patients. Lack of awareness of guidelines, especially amongst general practitioners (GPs), has been recognised as a barrier, as well as the expectation that other healthcare professionals should be addressing this aspect of care10. In our study, DEXA scans were mostly requested by the specialist breast team initiating AIs, or by the GP at the request of the breast team. Based on our experience, it is not clear who the responsibility of bone health management lies with – the breast surgery team, the oncologist or the GP. In a survey of 307 UK-based breast surgeons and oncologists 57% of responders felt that oncologists should be responsible for this18. In practice, patients may be discharged from specialist clinic follow-ups while they are still on hormonal therapy and GPs would be expected to continue their care. When this happened in our cohort of patients, there was no evidence of clear written communication from specialist teams to the GP regarding outstanding aspects of care that the GP would be expected to follow up.
An analysis of five different guidelines regarding antiresorptive treatment in postmenopausal women with hormone-receptor positive BC showed that little consistency exists among the five guidelines19. The variety of guidelines and recommendations regarding bone loss in BC patients probably leads to inconsistency in practice. In our study, specialist teams have sometimes recommended an interval of 3 to 5 years between BMD tests, deviating from the national recommendation of 2 years. This can translate into confusion when care is taken over by the community team after the patient is discharged from the specialist team.
Recommendations
We therefore suggest that institutional guidelines on bone health management in BC patients on AIs (as well as other hormonal therapies) should be created to improve awareness amongst clinicians as this has shown to improve rates of DEXA scanning10. Local guidelines should closely mirror national guidelines to allow delivery of standardised care across the country, but should include clear recommendations as to which local team should be responsible for bone health management, as well as recommendations regarding the creation of a care plan for general practitioners when the patient is discharged from specialist teams.
A UK-based study has shown that a “one stop” nurse-led bone health clinic within the breast care service can be a cost-effective way of ensuring adherence to guidelines20. Patients to be started on an AI are identified by the multidisciplinary team (MDT). They are referred to the clinic which arranges a baseline DEXA and other appropriate investigations. Such a clinic may be a consideration in institutions where resources allow. Studies have also shown that simple interventions such as presentations at MDT meetings and display of posters to increase awareness of guidelines amongst clinicians have led to significant improvement in compliance16,17.
Lack of patient awareness of the negative effects of AIs has also been highlighted in the literature21. Improving patient education can improve patients’ compliance with treatment and decrease the rates of unattended appointments for BMD screening. It can also give more control to patients over management of their bone health, as they may be able to discuss with their clinicians where they notice a gap (e.g. if they have failed to receive an appointment for a DEXA scan). Ligibel et al have noted that women from areas with lower levels of education are less likely to undergo BMD tests15.Patient education can also help reduce the impact that such health-seeking behaviours have on compliance to bone health management.
Current guidelines make no mention of bone health management in male BC patients on hormonal therapy. Although they constitute a small percentage of BC patients, it would be reasonable to include recommendations of their bone loss management in updated guidelines so that this aspect of their care is not neglected.
Strengths and limitations
Our audit is limited by its small sample size and its retrospective nature which meant that we relied on documentation of variable accuracy. We had no information regarding patients who failed to attend appointments despite their clinicians’ invitations for DEXA scans or biochemistry tests, and no information on compliance to medication. However, the results from recent conference abstracts on UK based studies22,23 generated from our literature review reflect our results, suggesting that this is indeed a national issue. The literature review presented is the most extensive currently available on the subject, gathering up-to-date evidence on worldwide compliance to guidelines on AIBL.
Conclusion
Although the sample size of our study does not allow us to draw conclusions purely based on our data, the literature review that it has prompted has shown that several years after issuance of various guidelines on the management of BC treatment-induced bone loss, in particular AIBL, important gaps still exist in practice. We have presented a summary of up-to-date evidence in the literature to identify potential reasons for this and possible solutions to the current problems, hoping that this will improve current practice.
However, the current guidelines are now several years old. In the last few years, there has been a lot of research on the role of bisphosphonates in BC. A consensus paper assessing recent evidence has suggested that bisphosphonates should be considered for the prevention of bone loss in patients with a T score of <-2.0 or with at least two clinical risk factors for fracture24. The paper also suggests considering the use of bisphosphonates as adjuvant BC treatment, based on a large meta-analysis including 18 766 patients which demonstrated significant benefits of bisphosphonates in terms of prevention of bone metastases and BC survival in postmenopausal women25. This may well change routine adjuvant treatment of BC in the next few years and must be taken into consideration if and when new guidelines on the management of AIBL are issued, or when writing local guidelines.
The non-vitamin K antagonist oral anticoagulants have demonstrated favourable benefit–risk profiles in large phase III trials, and these findings have been supported by real-world studies involving unselected patients representative of those encountered in routine clinical practice and including those deemed ‘challenging-to-treat’
Accurate detection of atrial fibrillation and assessment of stroke and bleeding risk is crucial in identifying patients who should receive anticoagulation
Elderly populations represent a significant proportion of patients seen in general practice, and advanced age should not be regarded as a contraindication to treatment; acetylsalicylic acid is not considered an effective treatment option to reduce the risk of stroke in patients with non-valvular atrial fibrillation (except for those declining oral anticoagulation), particularly in fragile elderly patients, for whom this drug was historically prescribed
The frequency of follow-up visits, in particular to check compliance, should be tailored according to patients’ clinical characteristics and needs, but there is no requirement for routine coagulation monitoring, unlike vitamin K antagonists
Atrial fibrillation: a clinical and economic burden to society
Atrial fibrillation (AF) is the most frequently encountered sustained cardiac arrhythmia, with a prevalence of about 1.5–2% in the general population1,2. Its incidence is predicted to rise sharply over the coming years as a consequence of the ageing population and increased life expectancy in those with ischaemic and other structural heart disease2. In addition to being associated with significantly increased rates of mortality3, AF is also associated with significantly increased rates of heart failure, which is both a common cause and consequence of AF and greatly worsens the prognosis4. However, it is stroke that is the most devastating consequence of AF, with an average fivefold increased risk5.
AF-related strokes are often more severe than other strokes6,7because the clots that embolise from the left atrium or left atrial appendage are often much larger8than from other sources of emboli. These clots usually lodge in large cerebral vessels, commonly the middle cerebral artery, resulting in huge neurological and functional deficits and increased mortality compared with other stroke types. Moreover, the strokes suffered by patients with AF are more likely to lead to extended hospital care than strokes in patients without AF, thus impacting on patients’ quality of life7.
Current evidence suggests that, in the UK, AF has a causative role in almost 20% of all strokes9. This is likely to represent a significant underestimate given that long term electrocardiogram (ECG) monitoring in patients who would previously have been diagnosed as having cryptogenic stroke has demonstrated a significant AF burden in these patients10.
With improved AF detection and stroke prevention, it is estimated that approximately 8000 strokes could be avoided and 2100 lives saved every year in the UK, resulting in substantial healthcare savings of £96 million11,12.
A key objective of this short review is to provide primary care clinicians with the confidence to manage patients with AF in need of anticoagulation, including the safe and appropriate use of the non-vitamin K antagonist oral anticoagulants (NOACs) apixaban, dabigatran, rivaroxaban (approved in the EU, US and several other countries worldwide) and edoxaban (approved in the EU, US and Japan).13-20The focus will be on how to accurately identify, risk-stratify and counsel patients on the risks and benefits associated with the different treatment options.
Who to treat. Accurate detection and assessment of stroke and bleeding risk
Many patients with AF are asymptomatic, particularly the elderly, less active patients who may not notice the reduction in cardiac performance associated with AF. Unfortunately, it remains the case that AF is undetected in up to 45% of patients21, and stroke is very often the first presentation of AF.
Both the National Institute for Health and Care Excellence (NICE) and the European Society of Cardiology (ESC) guidelines recommend opportunistic screening in patients aged ≥65 years by manual pulse palpation followed by ECG in patients found to have an irregular pulse1,22. Opportunistic screening (manual pulse palpation) was shown to be as effective as systematic screening (ECG) in detecting new cases23, and this simple strategy should be used to screen at-risk patient groups as often as possible. Hypertension and increasing age are the two leading risk factors for developing AF, but other high-risk groups include patients with obstructive sleep apnoea, morbid obesity or a history of ischaemic heart disease24-26. In the context of proactive AF detection, many initiatives have been launched worldwide to encourage primary care clinicians to integrate manual pulse checks into their routine practice. The Know Your Pulse campaign was launched by the AF Association and Arrhythmia Alliance during Heart Rhythm Week in 2009 and was quickly endorsed by the Department of Health in the UK and by many other countries. This initiative has assisted in diminishing some of the gaps in AF detection21.
The most frequently used tools to evaluate stroke risk in patients with non-valvular AF (AF that is not associated with rheumatic valvular disease or prosthetic heart valves) are the CHADS227 and CHA2DS2-VASc28scores, with recent guidelines favouring the use of the latter and emphasising the need to effectively identify ‘truly low-risk’ patients1. The CHA2DS2-VASc score is superior to CHADS2 in identifying these truly low-risk patients, who should not be routinely offered anticoagulation1. Patients with any form of AF (i.e. paroxysmal, persistent or permanent), and regardless of whether they are symptomatic, should be risk stratified in this way. The risk of stroke should also be assessed using CHA2DS2-VASc in patients with atrial flutter and probably for the majority of patients who have been successfully cardioverted in the past22. Unless the initial underlying cause has been removed (e.g. corrected hyperthyroidism) and there is no significant underlying structural heart disease, the risk of patients suffering from a recurrence of AF following ‘successful’ cardioversion remains high29. The ESC guidelines recommend that anticoagulation should be offered to patients with a CHA2DS2-VASc score ≥1 based on assessment of risk of bleeding complications and the patient’s clinical features and preferences1.
The new Quality and Outcomes Framework (QOF) for 2015–2016 now recommends the use of CHA2DS2-VASc for risk stratification and no longer recommends antiplatelet agents as a therapeutic option for stroke prevention in patients with non-valvular AF30; this should result in significantly more patients receiving anticoagulation for this indication. The changes to QOF 2015–2016 compared with 2014–2015 are summarised in Table 130.
Table 1. Summary of changes to UK the Quality and Outcomes Framework (QOF) 2015–201630
NICE indicator ID
Changes
2014–2015 points
2015–2016 points
NM45: Patients with AF and CHADS2=1 currently treated with anticoagulant therapy or antiplatelet therapy
Retired
6
–
NM46: Patients with AF and a latest record of a CHADS2 ≥1 currently treated with anticoagulant therapy
Replaced by NM82
6
–
NM82: Patients with AF and CHA2DS2-VASc ≥2 currently treated with anticoagulant therapy
Replacement
–
12
NM81: Patients with AF in whom stroke risk has been assessed using the CHA2DS2-VASc risk-stratification scoring system in the preceding 12 months (excluding those with a previous CHADS2 or CHA2DS2-VASc ≥2)
New indicator
–
12
Key: AF = atrial fibrillation; CHADS2 = Congestive heart failure, Hypertension, Age ≥75 years, Diabetes, Stroke (doubled); CHA2DS2-VASc = Congestive heart failure or left ventricular dysfunction Hypertension, Age ≥75 years (doubled), Diabetes, Stroke (doubled)-Vascular disease, Age 65–74 years, Sex category (female); NICE = National Institute for Health and Care Excellence
The Guidance on Risk Assessment and Stroke Prevention in Atrial Fibrillation (GRASP-AF) clinical audit software detection tool is now very widely used in primary care to improve clinical outcomes in the AF population by identifying patients likely to benefit from anticoagulation. GRASP-AF systematically scans general practice software systems and calculates CHADS2 and CHA2DS2-VASc scores in patients who are coded as having AF, thus enabling physicians to identify high-risk patients who are not adequately treated for stroke prevention31. Identification of AF patients who are poorly controlled on warfarin (defined as having a time in therapeutic range <65% or a labile international normalised ratio [INR], e.g. one INR value >8 or two INR values <1.5 or >5 within the past 6 months)22 is crucial because these patients are more likely to experience major bleeding or stroke. These patients should be reviewed and, if possible, the cause for the poor warfarin control should be identified. The Warfarin Patient Safety Audit tool is another software tool that has been developed to help identify patients with poor warfarin control32.
Primary care clinicians are being urged to objectively assess the bleeding risk of AF patients who are receiving, or about to receive, anticoagulation1,22,32. HAS-BLED is the bleeding assessment scheme advocated by both NICE and the ESC1,22, this has been validated in several independent cohorts and was shown to correlate well with the risk of major bleeding, in particular intracranial bleeding1. The key aspect of HAS-BLED is that, unlike CHADS2 and CHA2DS2-VASc, it consists of risk factors that are modifiable. It should, therefore, not be a tool to influence the decision of whether to anticoagulate, but instead to identify ways to reduce the risk of bleeding in patients receiving an anticoagulant; for example, optimising blood pressure control, stopping unnecessary antiplatelet or anti-inflammatory agents and reducing alcohol consumption can all significantly reduce HAS-BLED scores and bleeding risk1. In addition, it needs to be emphasised that the absolute number of patients with AF experiencing a serious bleeding event while receiving anticoagulant therapy is low (~2–3%/year in the XANTUS, PMSS and Dresden NOAC Registry real-world studies) , with prospective real-world studies indicating that most bleeding events can be managed conservatively33-35. Whilst concerns have been raised about not having a reversal agent to counter the anticoagulant action of NOACs in patients who experience serious bleeding, the low incidence of major bleeding in real-world and phase III studies and its conservative management in most cases demonstrate that such agents would not be required routinely. Despite these low rates of major bleeding, reversal agents have been developed and successfully completed phase III studies and undergone approval in some markets, including idarucizumab in the UK36,37. Notably, high-risk patients with AF were shown to be more willing to endure bleeding events in order to avoid a stroke and its consequences38, thus reinforcing the message that “we can replace blood but we cannot replace brain tissue”.
Adequate anticoagulation therapy should follow appropriate patient identification
Identifying the right treatment option for patients with AF is likely to improve clinical outcomes. Involving patients in the decision-making process and rationale, and ensuring they understand the net benefit–risk of treatment options, is likely to lead to better compliance and improved clinical outcomes. The ESC guidelines consider patients with valvular AF (patients with AF in the presence of either rheumatic mitral stenosis [very rare now in the UK] or prosthetic heart valves) to be at high risk, and these patients should be anticoagulated with a VKA regardless of the presence of any other risk factors1. Warfarin is very effective at reducing the risk of stroke compared with acetylsalicylic acid (ASA)39,40, but an unpredictable dose–response relationship and multiple drug and food interactions can be problematic for some patients, and many patients remain sub-optimally treated41. ASA is also not considered an effective treatment option to reduce the risk of stroke in patients with non-valvular AF especially in frail, elderly patients in whom ASA was historically prescribed. The GARFIELD-AF registry (10,614 patients enrolled in the first cohort) revealed that real-world anticoagulant prescribing in AF populations deviates substantially from guideline recommendations: 40.7% of patients with a CHA2DS2-VASc score ≥2 did not receive anticoagulant therapy, and a further 38.7% with a score of 0 received anticoagulant therapy. At diagnosis, 55.8% of patients overall were given a VKA, just over one quarter (25.3%) received an antiplatelet drug alone, and ~4.5% received a NOAC24. Inappropriate prescribing was further confirmed by data from UK general practices (n=1857, representing a practice population of 13.1 million registered patients) using the GRASP-AF tool. Only 55% of patients with high-risk AF (CHADS2 ≥2) were receiving oral anticoagulation (OAC) therapy, whereas a further 34% of patients with no known contraindication did not receive OAC therapy42.
The NOACs have altered the landscape in terms of stroke prevention management by increasing the available options for patients. These agents exhibit some important practical advantages over traditional therapy (e.g. no requirement for routine anticoagulation monitoring, simple fixed dosing oral regimens, fast onset of action, fewer drug reactions and no food interactions), leading to their increased uptake in primary care.
Key patient groups who are likely to benefit from the NOACs include patients poorly controlled on VKAs, those predicted to require medications that interact with VKAs (e.g. patients who require frequent antibiotics), those without severe renal impairment or those with a prior ischaemic stroke while receiving a VKA with an adequate INR. These agents could also be a good choice for patients living a considerable distance from their local hospital or surgery and commuters. The NICE guidelines state that primary care clinicians should consider clinical features and patient preference before deciding on the most appropriate option for patients22. In addition, cost may be important in some settings. All of the NOACs have demonstrated cost-effectiveness versus warfarin, and although cost models vary by country, there is little doubt that these agents provide cost-effectiveness largely through the number of adverse events avoided and their associated costs43.
Choice of anticoagulant: which to choose?
The demonstration of a favourable benefit–risk profile (stroke prevention vs bleeding events) in large phase III studies involving over 70,000 patients has resulted in the regulatory approval of apixaban, dabigatran, edoxaban and rivaroxaban44-47for the prevention of stroke and systemic embolism in patients with non-valvular AF and one or more risk factors.
Overall, NOACs have demonstrated an improved benefit compared with warfarin, with lower rates of intracranial haemorrhage (for all NOACs) and similar or superior efficacy for stroke prevention44-48. Statistically significant relative risk reductions (RRRs) in the incidence of fatal bleeding events were seen with low-dose dabigatran (110 mg twice daily [bd]; RRR=42%), both tested doses of edoxaban (30 mg once daily [od] and 60 mg od; RRR=65% and 45%, respectively) and rivaroxaban (20 mg od; RRR=50%)46,47,49; rates of fatal bleeding were also lower in patients treated with apixaban compared with warfarin (34 patients vs 55 patients, respectively)44. These data are promising, especially considering the current lack of a specific antidote for any of the NOACs, and it is likely that the very short half-life of these drugs play an important role in mitigating the bleeding risk.
Owing to a lack of head-to-head comparisons between the NOACs in phase III clinical trials, patient characteristics, drug compliance, tolerability issues and cost may be important considerations1. In addition, subanalyses of phase III trial data for rivaroxaban, apixaban and dabigatran indicate that the challenging-to-treat patient groups often encountered by primary care clinicians can be treated effectively and safely with the NOACs (Table 2). A recent meta-analysis showed a similar treatment effect for almost all subgroups encountered in clinical practice; NOACs appeared to be at least as effective as VKAs in reducing the risk of stroke and systemic embolism and no more hazardous in relation to the risk of major bleeding events, irrespective of patient co-morbidities50.
Table 2.Novel oral anticoagulants studied in key patient subgroups*
Subgroup analysis
Rivaroxaban
Dabigatran
Apixaban
Factors related to disease
ROCKET AF
RE-LY
ARISTOTLE
Heart failure
ü59
ü60
ü61
Renal impairment
ü62
ü63
ü64
Prior stroke
ü65
ü66
ü67
VKA-naïve
ü68
ü69
ü70
Prior MI or CAD
ü(prior MI)71
ü(CAD or prior MI)72
üCAD73
PAD
ü74
–
–
PK/PD
ü75
ü76
–
East Asian patients
ü77
ü78
79
Elderly
ü80
ü49
ü81
Major bleeding predictors
ü82
–
–
Obesity
–
–
–
Diabetes
ü83
ü84
ü85
Valvular heart disease
ü86
–
ü87
Paroxysmal versus persistent AF
ü88
ü89
ü90
*No subgroup analyses have been presented for edoxaban Key: AF = atrial fibrillation; ARISTOTLE = Apixaban for Reduction In STroke and Other ThromboemboLic Events in atrial fibrillation; CAD = coronary artery disease; CHADS2= Congestive heart failure, Hypertension, Age ≥75 years, Diabetes, Stroke (doubled); MI = myocardial infarction; PAD = peripheral artery disease; PK/PD = pharmacodynamics/pharmacokinetics; RE-LY = Randomized Evaluation of Long-term anticoagulation therapy; ROCKET AF = Rivaroxaban Once daily, oral, direct factor Xa inhibition Compared with vitamin K antagonism for prevention of stroke and Embolism Trial in Atrial Fibrillation; VKA = vitamin K antagonist
Because patient selection in clinical trials is based on strict inclusion/exclusion criteria, patient populations in such studies are not always representative of patients routinely seen in real-world practice. In addition, bleeding events may be managed differently in clinical trials versus routine clinical practice. Real-world data are, therefore, needed to help validate drug safety and effectiveness in unselected patient populations. Following phase III clinical trials and the widespread approval of the NOACs in stroke prevention in patients with non-valvular AF, real-world experience has been steadily accumulating. The current real-world data for rivaroxaban, apixaban and dabigatran have been very reassuring and bridge the evidence gap between clinical studies and real-world experience33-35,51-57.
The lack of routine coagulation monitoring with NOACs does not remove the necessity for regular follow-up. Instead, the frequency of visits can be tailored according to patients’ clinical characteristics and needs. NOACs are all partially eliminated by the kidneys; therefore, regular monitoring of renal function is important either to use a lower recommended dose of these drugs or to avoid them. For example, renal function should be monitored every 6 months in patients who have stage III chronic kidney disease (creatinine clearance [CrCl] 30–60 ml/min)58. Apixaban, rivaroxaban and edoxaban are not recommended in patients with CrCl <15 ml/min, and dabigatran is contraindicated in patients with CrCl <30 ml/min13,15,17,19. Reduced-dose regimens of NOACs are recommended for patients at higher risk of bleeding events, including those with reduced renal function. For example, a reduced apixaban dose of 2.5 mg bd is indicated in patients with at least two of the following characteristics: age ≥80 years, body weight ≤60 kg or serum creatinine ≥1.5 mg/dl (133 μmol/l); a reduced rivaroxaban dose of 15 mg od is indicated in patients with CrCl 15‒49 ml/min58; edoxaban is recommended at a reduced dose of 30 mg od in patients with CrCl 15‒50 ml/min and contraindicated in patients with CrCl >95 ml/min58; and a reduced dose of 110 mg bd dabigatran should be considered in patients with CrCl 30‒50 ml/min who are at a high risk of bleeding58. Follow-up visits should also systematically document patient compliance, thromboembolic and bleeding events, side-effects, co-medications and blood test results58.
Conclusions
The NOACs have demonstrated favourable benefit–risk profiles in large phase III trials, and these findings have been supported by real-world studies involving unselected patients, including those deemed challenging to treat. The NOACs also address many of the limitations associated with VKA use, thus assisting with their integration into clinical practice for stroke prevention in patients with non-valvular AF. In addition, the results from subgroup analyses should provide primary care clinicians with the confidence to manage stroke-prevention strategies in a wide variety of patients with AF.
Currently, depression is the leading cause of disability in the world and is predicted to become the second largest killer after heart disease by the year 20201. Eighty percent of individuals with depression report functional impairment while 27% report serious difficulties at work and home life2. According to a study conducted in 2011, India has the highest rate of depression (36%) in low income countries with women being affected twice more than men3. Cancer in children occurs randomly and spares no ethnic group, socio-economic class, or geographical region. An estimated 11,630 new cases are expected to occur among children aged 0-14 years in 2012 in the US, out of which 1,310 will die by end of 2013 due to it4. Based on Karachi Cancer Registry it is estimated that about 7500 children get cancer every year in Pakistan5. The mortality rates for childhood cancers have declined by 68% over the past four decades, from 6.5 per 100,000 in 1969 to 2.1 in 20094. However, the diagnosis of cancer in one’s child marks the beginning of social and psychological devastation for the whole family especially the mother. The length and intensity of treatment can be as distressing as the disease itself, negatively affecting their functionality as parents and in turn the child’s ability to handle the treatment6. As a primary care provider mother’s responsibility increases substantially starting a vicious cycle of anxiety and socio-economic uncertainty leading her to depression much more than the father7. The available data supports that mothers of children with cancer represent a group prone to high levels of emotional distress, and that the period following their child’s diagnosis and the initiation of treatment may be predominantly stressful and disturbing leading them to depression8. Such mothers have difficulty in taking care of themselves, their household and especially their sick children. Many parents continue to suffer from clinical levels of distress, even after five years off treatment of their child7. Many studies have shown that chronic depression and distress may lead to decrease in immune functioning and an increased risk of infectious disease in healthy individuals 9-11. Mothers are generally with the child mainly and hence are most affected from their child’s disease. In this study, we intended to estimate the frequency and severity of depression in mothers having children with cancer.
There is limited evidence from Pakistan regarding depression in mothers of children with cancer. The previous studies conducted had certain limitations such as small sample size, assessment of depression in both parents and that too of children with leukaemia only. This study intends to determine the frequency and severity of depression among mothers of children with cancer.
Methods
A cross sectional survey was conducted in the paediatric oncology clinics at The Aga Khan University Hospital, a teaching hospital in Karachi over a period of six months (September 2011- March 2012). Mothers of children with cancer were enrolled in the study, consecutively according to the inclusion and exclusion criteria. Mothers having children less than 15 years of age with any type of cancer, diagnosed by oncologist (2 months after diagnosis to rule out bias for normal grief period)12, mothers bringing their sick child for the first time to the teaching hospital or as follow up or for day care oncology procedures were included in the study. Mothers who had existing psychiatric illness (and or already diagnosed as having depression by a doctor) and/or taking medications for it, any recent deaths in family (within six months of interview) or having other co-morbidities (malignancy, myocardial infarction in previous year, neuromuscular disease limiting ambulation or blindness) were excluded.
A pre-coded validated and structured Urdu13, 14 and English15, 16 version of the questionnaire was used for data collection the questionnaire took about 20 minutes to complete and consisted of two sections. Section A, included mother’s and child’s demographic details and treatment status. Section B, consisted of Hamilton Depression Rating Scale (HAM-D 17) a validated scale (sensitivity 78.1% and specificity 74.6%) for assessing frequency and severity of depression in both hospitalised patients and the general population15. Scores of < 7 indicate no depression and scores > 7 are labelled as depressed. Mothers who were found to be depressed were further classified into mild (scores 8-13), moderate (scores 14-18), severe (scores 19-22) and very severe depression (scores > 23)16. Mothers with mild to moderate depression were referred to the family physicians; those with severe, very severe, or suicidal tendencies were urgently referred to a psychiatrist.
Institutional Ethical Committee of the Aga Khan University Hospital approved the study. Confidentiality of participants was maintained and informed written consent was obtained.
Sample sizecalculated by WHO software. The prevalence of maternal depression ranges from 56.5% to 61.5% 17, 18 as evident from different international studies. With 95%, confidence interval and bound on error of 10% the sample size came out to be 95. After an addition of 5% for non-responders, the total required sample size was 100 study participants. Data was double entered and analyzed in SPSS version19. The outcome variable was dichotomized as no depression and depression (cut off score7). Analysis was performed by calculating frequencies of categorical variables (maternal age, education, current marital status, employment, co- morbidities, diagnosed depression and treatment in mother, number of children, gender of sick child, cancer type, time since diagnosis of cancer in child, treatment given so far and current treatment status of child and family income). Means and Standard Deviation was reported for current age of the child.
Results
One hundred and sixty mothers were approached out of which 100 mothers consented to participate in the study yielding a response rate of 62.5% (100/160). With regards to the mothers the most common age group was the 30-39 year old category (43%). Fifty-five percent of mothers had a high level of education (those who had completed class 11-12 or engaged in professional education). Nearly all the mothers (98%) were married and were homemakers (95%). Only 5% of mothers were working outside the home. More than half of the participants (57%) had one to three children while 43% had more than three. Monthly financial income for 65% of the participants were more than fifty thousand Pakistani rupees (Table 1).
Table 1: Demographic Characteristics of Mothers (N=100)
Variables
N
%
Age of mother
20-29 years
39
39.00%
30-39 years
43
43.00%
40 years and above
18
18.00%
Education Level of mothers*
No education
13
13.00%
Primary/secondary/intermediate
32
32.00%
Higher
55
55.00%
Marital status of mothers
Currently Married
98
98.00%
Divorced
1
1.00%
Widow
1
1.00%
Maternal Employment Status
Housewife
95
95.00%
Working
5
5.00%
Number of children
1-3
57
57.00%
More than 3
43
43.00%
Family Income
< 20,000
4
4.00%
20,000-50,000
31
31.00%
>50,000
65
65.00%
* (Not Educated: Those who do not have primary education, Primary 1-5 years of schooling, Secondary: 6 to 10 years of schooling, Intermediate: Who have studied class 11 and 12, Higher: Who have completed or engaged in professional education)
The demographic characteristics of child are detailed in Table2. Seventy-five percent of sick children were male while 25% were females (n=100). Half the children were diagnosed with cancer between the age of three to nine. Fifty percent of children (n=50), had their diagnosis of cancer in the last one to five years. More than half of children (57%) were on treatment during study phase. Different types of cancers occurring in children are shown in Figure1.
Table 2: Demographics and social characteristics of sick child (N=100)
Variables
N
%
Current age of child *
6.90(±3.40)*
Gender of Sick Child
Male
75
75.0%
Female
25
25.00%
Age of child at cancer diagnosis
10months-3 years
40
40.0%
3 -9 years
50
50.00%
More than 9 years
10
10.00%
Time since diagnosis of child’s cancer
< 1 year
15
15.0%
1-5 years
50
50.00%
>5 years
35
35.00%
Current treatment status of child
On treatment
57
57.0%
Off treatment
43
43.00%
*Mean (SD) (t-test values)
Figure 1: Frequency of various types of cancer in children (N=100) *Others (BLL, Rhabdomyosarcoma, Glioblastoma, Nephroblastoma) Seventy eight percent of the mothers were depressed. Sixty-nine percent (n= 54) had mild depression, nearly 25% (n=19) had moderate, while 5% (n= 4) had severe and 1% (n=1) had very severe depression.(Table 3)
Table 3: Frequency and levels of severity of Depression in mothers
Variables
N
%
Frequency of Depression (n=100)
Depression present
78
78%
Depression absent
22
22%
Severity of Depression (n=78)
Mild
54
69%
Moderate
19
25%
Severe
4
5%
Very severe
1
1%
Discussion
Depressed patients are frequently encountered in nearly all specialty clinics. However, depression in caregivers accompanying patients is usually overlooked and hence missed, as doctors are mostly focused on the patient’s evaluation, condition, and treatment. When the patient is a child and the diagnosis is cancer, this difficult circumstance has a sudden and long term impact on both the child and the family. Many parents of a child with cancer will have very strong feelings of guilt. As such, parents of cancer survivors may be at risk for impaired physical and mental health. An increasing body of literature supports the conclusion that various levels of parental distress are ongoing, long after treatment is completed 19, 20.
The prevalence of depression in mothers in this study was as high as 78%. Mild depression was seen in 69% of mothers, moderate in 25%, severe in 5% while 1% had very severe depression. This high prevalence of depression in such mothers has not been reported from Pakistan before. The soaring levels of depression however have been consistent with the study conducted in Turkey in 2009 in mothers of children with leukaemia21 where 88% (n=65) mothers were depressed. Mild depression was reported in 22.7 % (n=18) and major depression in 61.5% (n=40). Similar results were reported from a study conducted on both parents of children with leukaemia in 2002 in Pakistan where 65% (n=60) of mothers were found to be depressed 17. Nevertheless, severity of depression in this study was not noted. A Sri Lankan study in 2008, showed moderate to severe depression to be 22.9% and 21.9% in mothers having children with mental and physical disorders respectively22. Another study conducted in Florida in 2008 suggests that an increased symptom of depression in mothers is related to significantly lower ratings in quality of life for their children18.
The existing data supports the argument that mothers of children with cancer represent a group prone to high levels of emotional distress. The time following their child’sdiagnosis and the commencement of treatment may be particularly stressful and traumatic 23 with an incidence as high as 40% 24-26. There could be multi-factorial reasons for this alarmingly high rate of depression seen in Pakistani mothers. One of the causes could be the political instability that Pakistan has been facing for past few years leading to economic volatility. The study conducted in 2002 in Karachi saw 65% of maternal depression17 which has now risen to 78% in this study. Due to political unrest, everyday strikes, bombasts, these mothers may also have difficulty in reaching hospital on scheduled visits leading to postponement of treatment. Other reason could be economic inflation. The cost of daily living has soared while allocated medical budget was 0.27% of its gross domestic product (GDP) on health in 2011-12, which is insufficient to cater the needs of the population (Economic Survey of Pakistan of 2011-2012).
Lately, there has been a recent trend towards nuclear families in Pakistan rather than living in extended families as before27. This in turn may lead to mother being the soul person in looking after the sick and her healthy children as well as managing house chores and doctor’s appointments leading to more frustration. This study also showed that 57% mothers had three children while 43% had more than three children. This could also be one of the factors for high rate of depression as looking after multiple children is demanding and may lead to decreased coping skills of mothers.
Other possible reason for this high rate of depression could be that mostly educated mothers were visiting the hospital that have access to internet and can search up all details, good or bad, on their child’s disease. This may start a vicious circle of worry for mothers. Other possible reasons for this growing depression could be gender of child (as in this society male child is thought to be the support and bread earner of the family), child’s current treatment status and time since diagnosis of cancer in child.
Strengths and Limitations
To the best of authors’ knowledge, this study has touched upon a topic that was not yet been attended to, in local context. Moreover, in this study adjustment phase of two months, for acute stress and posttraumatic stress disorder was given for diagnosis of depression in mothers. It was done to rule out bias in study. HAM-D also focuses on symptoms in the past 1 week, to minimize the recall bias. The findings in this study offer evidence and importance of the need for developing psychological support for families especially mothers who are caring for a child with cancer, in Pakistan.
This study has several limitations. The study was conducted in a tertiary care private hospital, which mostly caters a specific segment of population. Hence, the results may not be a true representation of the population. All data in this study was self-reported by the participants. Thus, it is anticipated that there may be some bias in their responses and recall. Lastly, since this was a cross-sectional study so temporality is difficult to establish.
Conclusion
In conclusion more than three-fourth of our study participants were depressed.
The outcome is expected to identify depressed mothers so that effective strategies can be developed to enhance their coping skills and medically treat them when required. This in the long term is expected to increase quality of life for both their sick and healthy children as well as mothers themselves.
Future Research and Policy Recommendations
Future studies are recommended in order to confirm our findings. Such studies need to be conducted on a larger scale, at national level, in various hospitals and settings to counteract limitations of our study with appropriate means of measuring depression in mothers. Factors, not explored in this study such as personality styles and coping skills of mothers can be explored as these may be significant aspects leading to depression. Further co-morbidities, such as anxiety and post traumatic stress disorder symptoms related to child’s cancer should also be investigated.
Other associated factors, such as the political and economic situation, which perhaps may also be a leading cause of depression in our part of the world, should also be assessed. Simultaneously, measures should be taken to root such factors out at national levels.
The results of current study show the need of incorporating mothers into a treatment process designed for psychological interventions, not only after the diagnosis of cancer in their child but also during their child’s treatment. Psychosocial services should be recognised as an important constituent of comprehensive cancer care for families of children with cancer.
It is highly advocated that the healthcare professionals who work with the families of children with cancer should evaluate the children and their families concerning the psychological and social aspects of their lives. Arrangements for family counselling for those needing help should be made. Mothers should also be referred to family physicians and social support if available. The mother’s crucial position in the family and the proximal and distal effects of her adaptation to the crisis of cancer in the family should lead to the design of interventions intended at decreasing her distress and at promoting her adaptive coping skills as improving mothers’ problem-solving skills has been associated with reductions depression and anxiety28. Thus, all hospitals, dealing with paediatric cancer cases should have a family counselling and support system.
Routine pulse palpation is the recommended screening method to detect asymptomatic atrial fibrillation (AF) in clinical practice¹. Since this is part of the blood pressure (BP) measurement technique when using the Riva Rocci (mercury) device or the aneroid device, most patients are evaluated for rhythm irregularity while checking their BP, and, if pulse isn’t palpated, heart rhythm can be evaluated through auscultation of Koroktoff’ sounds. According to the European Community law (2007/51 CE; 2007 September 27th), the mercury sphygmomanometers should not be sold any more, therefore aneroid or automatic devices will replace them in a few years. Recently new devices with embedded algorithms to detect irregular heart beat and possible AF have been commercialised. Whether the switch from Riva-Rocci or aneroid sphygmomanometer to this device will affect detection of AF in usual care is unknown. We explored this issue using a retrospective, naturalistic observation of a group of GPs who abandoned the “old” Riva-Rocci or the aneroid sphygmomanometer and adopted this new device.
Methods
In September 2011 the members of the Italian College of General Practitioners based in Bologna (a medium size city in Central Italy) decided to standardize their office BP measurements. They received an unconditional grant for 30 automatic upper arm blood pressure monitors (Microlife- Afib ®) to be used in office by the GP him/herself. This device embeds an algorithm that calculates the irregularity index (standard deviation divided by mean) based on interval times between heartbeats; if the irregularity index is above a certain threshold value, atrial fibrillation is likely to be present and an atrial fibrillation icon is displayed on the screen. The 30 general practitioners who received the device agreed to a later proposal to examine their database to evaluate detection of new AF patients. They all had the same professional software (Millewin®), and used an automatic extraction. All the patients with recorded diagnosis of hypertension were identified, then BP recording and AF diagnosis were extracted before (365 days preceding the use of Microlife) and after (4 months since starting the use of Microlife) the adoption of the automatic devices. The proposal to examine AF detection was made after four months after they received the devices, therefore the GPs weren’t aware of this study during the usual professional activity. This study was also neither planned nor known by Microlife. Fourteen other GPs, who were using the traditional device, volunteered to provide the same data extraction from their personal database.
Results The 30 participants GPs cared for 48,184 individuals, 12,294 (25.5%) of whom had hypertension (mean age 69.9±13.4). The 16 control GPs cared for 23,218 patients, 5,757 (24.8%) with hypertension (mean age 69.7±13.6). The four-monthly AF detection rate for the original group and the control group is reported in table 1. All the new detected AF were then confirmed on ECG. Statistical analysis was made with the chi-square (χ²) test.
Table 1: Four-monthly AF detection rate in the original GP group and in the control group*
N° GPs and (n° hypertensive patients)
Detected AF % and (n° pts) October 2010- January 2011
Detected AF % and (n° pts) February 2011- May 2011
Detected AF % and (n° pts) June 2011- September 2011
Detected AF % and (n° pts) October 2011-January 2012
30 (12294) - original group
0.37% (46) *
0.3% (39) *
0.37% (45) *
0.63% (77) **
16 (5757) - controls
0.35% (20) ‡
0.45% (26) ‡
0.56% (32) ‡
0.33% (19) ‡‡
*‡ Use of the traditional device: original group vs controls: p NS ( χ² = 3.0421, df 1) ** use of the automatic device (other quarters use of traditional device) **‡‡ Original group: use of the automatic device vs traditional device in AF detection: p < 0.005 (χ ² = 9.487, df 1)
Discussion
Atrial fibrillation can be difficult to diagnose as it is often asymptomatic and intermittent (paroxysmal). The irregularity of heart rhythm can be detected by palpation of the pulse. It may therefore be detected in patients who present with symptoms such as palpitations, dizziness, blackouts and breathlessness, but may also be an incidental finding in asymptomatic patients during routine examination. The diagnosis must be confirmed with an ECG, which should be performed in all patients, whether symptomatic or not, in whom atrial fibrillation is suspected due to the detection of an irregular pulse. Heart rhythm should be evaluated while measuring BP with traditional sphygmomanometers, while this information may be lost with automatic devices, therefore the use of automatic devices with algorithms which can detect possible AF is an appealing choice. The hypothesis that these devices are equal or superior to systematic pulse palpation is currently under investigation by NICE². At the moment the consequences of switching from the classical Riva-Rocci devices to these new ones in usual care isn’t known. The AF opportunistic screening in people aged > 65 leads to a 1.63% detection rate while usual care has a detection rate of 1.04%, very similar to that observed in our hypertensive population (1.13%)³. Our data show that, at least in the short term, switching from the usual device to an automatic device with algorithm for irregular beat detection increases the identification rate of previously unknown AF in the hypertensive population. While waiting for a formal appraisal, GPs who wish or must renounce to their “old” Riva-Rocci can use this device implementing their “usual care” performances.
Mycobacterium tuberculosis was first isolated on 24th March 1882 by a German Physician Robert Koch, who received a Nobel Prize for this discovery in 1905 1. Tuberculosis is one of the oldest diseases in the history of mankind with evidence of tubercular decay found in some Egyptian mummies from 3000-2400 BC 2. The study of tuberculosis was also known as phthisiatry from phthisis, the Greek term for tuberculosis. Hippocrates identified phthisis as the most widespread disease of the time which involved the coughing up of blood, fever and was almost always fatal 3. Avicenna first identified that pulmonary TB was an infectious disease and developed the method of quarantine in order to limit the spread of disease 4 & 5. The disease was given the name of tuberculosis in 1839 by JL Schonlein 6.
Burden Of Disease
Tuberculosis (TB) is an infectious disease caused by various strains of mycobacteria; of which the commonest cause is Mycobacterium tuberculosis 7. The disease can affect any part of human body but commonly attacks the lungs. One third of the world’s current population has been infected by Mycobacterium tuberculosis and new infections occur at a rate of 1 per second 8. About 5-10% of these infections leads to active disease which, if left untreated, kills about 50% of its victims. TB affects approximately 8 million people worldwide and about 2 million people die of this disease annually. In the 19th century pandemic tuberculosis killed about 1/4th of the adult population of Europe 9. Nevertheless, these figures may be only the tip of the iceberg. Tuberculosis is again on the rise and main cause for the resurgence of TB is immunodeficiency as a result of HIV co-infection or, less commonly, immunosuppressive treatment such as chemotherapy or corticosteroids.
Introduction To Mycobacteria
Mycobacteria are aerobic and non-motile bacteria (with the exception of Mycobacterium marinum which is motile within macrophages) which are characteristically alcohol-acid fast 10. They are present in the environment widely in water and various food sources. They are usually considered to be Gram-positive bacteria, but they do not generally retain the crystal violet stain and are thus called Gram-positive acid-fast bacteria. These acid-fast bacilli (AFB) are straight or slightly curved rods 0.2-0.6 mm wide and 1-10 mm long. Mycobacteria are classified on the basis of growth & their ability to produce pigment.
On the basis of growth:
Rapid growing: Mycobacteria that forms colonies clearly visible to naked eye within 7 days on sub-cultures
Slowly growing: Mycobacteria that do not form colonies clearly visible to naked eye within 7 days on sub-culture
On the basis of pigmentation mycobacteria are divided into 3 groups:
Photochromogens (Group I): Produce non-pigmented colonies in dark and pigmented colonies when exposed to light and re-incubation e.g., M. kansasii, M. marinum etc
Scotochromogens (Group II): Produce deep yellow to orange colonies when grown in the presence of either light or darkness e.g., M. scrofulaceum, M. xenopi etc
Non-chromogens (Group III & IV): Non-pigmented in light and dark or only a pale yellow, buff or tan pigment that does not intensify after exposure to light e.g., M. tuberculosis, M. avium-intra-cellulare, M. ulcerans etc
For Clinical Purposes mycobacteria are divided into 3 main classes:
Mycobacterium tuberculosis complex: These are the mycobacteria which can cause TB and include M. tuberculosis, M. bovis, M. pinnipedii, M. africanum, M. microti and M. canetti.
Mycobacterium leprae causes leprosy, also known as Hansen’s disease.
Non-tuberculous mycobacteria (NTM) or environmental mycobacteria, atypical mycobacteria and mycobacteria other than tuberculosis (MOTT). These include all other mycobacteria which can cause pulmonary disease resembling tuberculosis, lymphadenitis, skin disease or disseminated disease. These include: Mycobacterium avium complex, Mycobacterium abscessus, Mycobacterium fortuitum and M. Kansasii which can cause both tuberculosis and leprosy in mammals.
Spread Of Tuberculosis
Today we know that TB is an airborne and highly infectious disease. A person becomes infected when he or she inhales Mycobacterium tuberculosis suspended in air as micro-droplets. Patients suffering from pulmonary TB who have detectable Mycobacterium tuberculosis in their sputum are known as smear positive cases of pulmonary TB. The bacterial load in sputum can be as high as 10,000,000 bacilli/mL. When such smear positive patients of pulmonary TB cough, sneeze or expectorate they produce micro-droplets of phlegm containing Mycobacterium tuberculosis (MTB). The size of these micro-droplets varies from 0.5 to 5mm in diameter. These micro-droplets can remain suspended in air up to 8 hours or even more (depending upon droplet size and environmental conditions including air flow). A single sneeze can produce up to 40,000 of these droplets 11. MTB cannot invade the mucous membranes of the respiratory tree and must reach the alveoli where it replicates. The size of the MTB-containing micro-droplet must be <1mm to be carried to the end of the bronchial tree otherwise it will be deposited on the walls of bronchial tree and cleared away by mucociliary action. Current knowledge asserts that even less than 10 bacteria may cause pulmonary infection 12 & 13. A sputum smear positive patient of TB, if left untreated, can cause infection in 10-15 new people each year.
Definition of TB contacts: People exposed to someone with infectious TB, generally including family members, roommates or housemates, close friends, coworkers, classmates, and others. They are a high priority group for latent-TB infection (LTBI) treatment as they are at high risk of being infected with TB.
Definition of close TB contacts:A person who had prolonged, frequent, or intense contact (i.e. >8 hours/day) with a person with sputum positive TB while he or she was infectious. They are more likely to become infected with TB than the contacts those who see the patient less often.
Pathogenesis
Once in the distal end of bronchial tree, MTB is engulfed by a macrophage in order to start replication within this host cell. Depending upon genetic factors, these macrophages can provide a variable environment for the replication of MTB. If this primary infection starts with a single mycobacteria and the initial host response is incapable of halting this process, within weeks or months there will be millions of tubercle bacilli within the body. MTB spreads in sequence from this primary site to the hilar-mediastinal lymph node initially. When seen on the X-ray, this primary focus of pulmonary infection is called a Gohn focus. It is generally located in the upper lobe or the apical segment of the lower lobe 7. The Gohn focus plus enlarged hilar-mediastinal node is called a Gohn complex. Tubercle bacilli enter the thoracic duct from the hilar-mediastinal lymph nodes, then by passing via the subclavian vein and right atrium, gain access to pulmonary and systemic circulation. As a result MTB can access, and subsequently infect, any organ of the body. Immunocompetent hosts can normally generate an effective immune response within 3-8 weeks, which tackles the primary Gohn focus and can cause involution of the lesions throughout the body. This immune response is a delayed type hypersensitivity reaction to the cell wall protein of bacilli and this is also responsible for positive tuberculin skin test, which appears 4-12 weeks after infection. The primary immune response is not however sufficient to sterilize the tissues and MTB can remain dormant in these foci. Latent foci may persist in the lungs or other organs of the body and are capable of producing disease reactivation which may be pulmonary or extra-pulmonary. In some cases where the initial host response is not capable of causing involution of the primary disease (such as infancy or an immunocompromised state) the infection proliferates and spreads, causing so-called “progressive primary disease”.
Mycobacterium bovis is a mycobacterium that causes tuberculosis in cattle but which can also infect humans. It can be transmitted from cattle to human by ingestion of infected milk and very rarely by inhalation of animal aerosol micro-droplets and by eating infected raw meat. The process of pasteurisation kills M. bovis and other bacteria in milk, meaning that infections in human are rare 14.
When To Suspect Tuberculosis
Primary Tuberculosis: Tuberculosis caused by infection with tubercle bacilli and characterized by the formation of a primary complex in the lungs consisting of a small peripheral pulmonary focus and hilar or para-tracheal lymph node involvement; it may cavitate and heal with scarring or progress. It is mainly seen in children but 10% cases of adults suffering from pulmonary TB have primary infection.
Reactivation Tuberculosis: Also known as chronic TB, post-primary disease, recrudescent TB, endogenous reinfection, and adult type progressive TB. It represents 90% of adult cases (in a non-HIV population), and is due to reactivation of dormant AFBs which are seeded at the time of the primary infection. The apical and posterior segments of the upper lobe and superior segment of the lower lobe of the lung are frequently involved.
Clinical Features:Symptoms and signs vary greatly as do radiological signs. A literature review showed that common signs and symptoms seen in TB infection were 15, 16, 17, 18:
Cough, which can be either productive or non-productive; it is often initially a dry cough which can later become productive.
Fever which seen in usually 70% of cases; generally it is low grade but could be as high as 390C, lasting for 14 to 21 days and in 98% cases is resolved completely by 10 weeks.
Night sweats which is usually seen in 50% of cases
Weight loss
Pleural effusion: 50% of the patients with pleuritic chest pain had pleural effusion
Chest pain: mainly pleuritic with some patients describing retrosternal and inter-scapular dull pain occasionally worsened by swallowing. This pain is believed to be due to enlarged bronchial/ mediastinal lymph nodes
Dyspnoea can be present in 33% of cases
Haemoptysis can be seen in 25%of cases
Fatigue
Arthralgia
Pharyngitis
Common radiological findings were as follows:
Hilar lymphadenopathy: can be seen as early as 1 week after the skin conversion and in almost all of cases within 2 months. It can be associated with right middle lobe collapse
Pleural effusion: typically within the first 3-4 months but can be seen as late as one year
Pulmonary infiltrates mainly in the upper zones and peri-hilar areas
How To Investigate19
HIV testing should be done in all patients presenting with clinical features of tuberculosis
Active Pulmonary TB
CXR: Perform an X-ray chest PA view. If the appearance is suggestive of active tuberculosis perform further investigations
Sputum smear & culture for AFB: send at least 3 sputums for AFB smear and culture including at least one early morning sample. This ideally should be before starting treatment or within 7 days of starting treatment.
If clinical features and CXR are suggestive of active TB, do not wait for culture and sensitivity results, start the patient on the 4 drug initial treatment. This can be modified according to culture results later on.
Active Non-Respiratory TB
A tissue sample should be taken from the suspected non-respiratory site and sent for histological analysis, AFB smear and culture analysis. Common examples of non-respiratory tuberculosis are tuberculous lymphadenopathy, tuberculous meningitis and disseminated tuberculosis.
Physicians should think about CNS tuberculosis such as TB meningitis if a patient with risk factors (i.e., immigrants from endemic areas, positive history of close contact etc) presents with signs and symptoms such as headache, low grade fever, photophobia and/ or focal neurological signs. Lumbar puncture (LP) after a CT brain to rule out any contra-indication for LP may yield the diagnosis in these scenarios. An MRI brain is also very sensitive for picking up tuberculomas in such cases.
Latent TB
Offer Mantoux testing to the household contacts and close contacts of the person with active TB (aged 5 and older). If the Mantoux is positive or if results are unreliable, as can be the case with BCG-vaccinated persons consider interferon gamma testing (T-spot TB Test). If Mantoux is inconclusive, the patient should be referred to a TB specialist. A similar approach should be used for new entrant TB screening.
QuantiFERON-TB Gold (QFT-G) Test & QuantiFERON-TB Gold in Tube (QFT-GIT) Test
Both of these tests have replaced the QuantiFERON-TB (QFT) Test. It is an interferon gamma release assay (IGRA) and measures a component of cell-mediated immune reactivity to mycobacterium tuberculosis. In QFT-G test a blood sample is mixed with antigens (2 Mycobacterium TB protein) and a control. Mixtures are incubated for 16 to 24 hours and then the amount of interferon gamma is measured. If the patient is infected with mycobacterium TB, white blood cells will release interferon gamma when they come in contact with TB antigens. Clinical features, chest X-ray and sputum/ tissue smear and culture for AFB are needed to differentiate between active and latent TB.
Its advantages over tuberculous skin testing are:
This test requires a single patient visit to draw a sample
Results are available within 24 hours
Results are not dependent on reader
It is not affected by prior BCG vaccination
Its limitations/ disadvantages include:
The blood sample must be processed within 12 hours of collection (while white cells are still viable)
There is limited data for use of QFT-G in immune-compromised patients, children under 17 years of age and persons recently exposed to MTB
False positive results may occur with Mycobacterium szulgai, kansasii and marinum infection
QFT-GIT is a modification of QFT-G test. It consists of 3 blood collection tubes containing: 1) no antigen, 2) TB antigen, 3) mitogen. These tubes must be transferred to an incubator within 16 hours of blood collection. Interferon gamma detection is then carried out via ELISA. Its specificity varies from 96-99% and sensitivity is as high as 92% in individuals with active disease.
T-Spot TB Test
It is a type of ELISPOT assay, developed by the researchers at the University of Oxford in England. It counts the number of effector T-cells in the blood that produce gamma interferon so gives an overall measurement of antigen load on immune system. As it does not depend upon production of antibody or recoverable pathogen, it can be used to detect latent TB and it is much faster. In one study it was found that its sensitivity is 97.2% 20.
Treatment Of Tuberculosis (Caused By Mycobacterium Tuberculosis)
Active TB will kill 2 of every 3 people affected, if left untreated. Disseminated TB is 100% fatal if untreated. For the treatment of TB, drugs are used in combination and never singly. Patients require regular supervision of their therapy during treatment to monitor compliance and side effects of medications. Treatment of atypical mycobacterial infections should be under the care of specialized units as this needs special care and drug regimens are complicated. Drugs for treatment of TB are divided into 3 categories:
1st Line Drugs: 1stline anti-TB drugs are very effective against TB. There are 5 first line drugs. All have 3 letter and 1 letter standard abbreviations.
Rifampicin is RMP or R
Isoniazid is INH or H
Ethambutol is EMB or E
Pyrazinamide is PZA or Z
Streptomycin is STM or S
Using a single drug usually results in treatment failure and drug resistant strains 21. The frequency of Mycobacterium tuberculosis developing spontaneous mutations conferring resistance to an individual drug is well known: 1 in 107for EMB, 1 in 108 for STM & INH, 1 in 1010 for RMP 22. A patient with extensive pulmonary TB usually has 1012bacteria in his body and hence will have about 105 EMB-resistant bacteria, 104 STM-resistant bacteria, 104 INH resistant bacteria and 102 RMP resistant bacteria. Drug-resistant tuberculosis occurs when drug-resistant bacilli outgrow drug-susceptible bacilli. Mutations can produce bacilli resistant to any of the anti-tuberculosis drugs, although they occur more frequently for some drugs than others. The average mutation rate in M. tuberculosis for resistance to isoniazid is 2.56 x 10⁻⁸mutations per bacterium per generation; for rifampicin, 2.25 x 10⁻¹⁰; for ethambutol, 1.0 x 10⁻⁷; and for streptomycin, 2.95 x 10⁻⁸. The mutation rate for resistance to more than one drug is calculated by multiplying the rates for the individual drugs. For example, the mutation rate for resistance to both isoniazid and rifampicin is approximately 2.56 x 10-8 times 2.25 x 10-10, or 5.76 x 10⁻¹⁸. The expected ratio of resistant bacilli to susceptible bacilli in an unselected population of M. tuberculosis is about 1:106 each for isoniazid and streptomycin and 1:108 for rifampicin. Mutants resistant to both isoniazid and rifampicin should occur less than once in a population of 1014 bacilli. Pulmonary cavities contain about 107 to 109 bacilli; thus, they are likely to contain a small number of bacilli resistant to each of the anti-tuberculosis drugs but unlikely to contain bacilli resistant to two drugs simultaneously 23.
There are different regimens available for the treatment of TB. The initial 2 months of treatment (usually rifampicin based) is called Initial Phase or Intensive Phase Treatment which later leads to Continuation Phase Treatment. Initial intensive phase treatment is designed to kill actively growing bacteria. Drugs are listed using their single letter abbreviation and a prefix denotes the number of months a treatment has to be given and a subscript denotes intermittent dosage. For example; 2RHEZ/4RH3 = 2 months of initial phase treatment with Rifampicin, Isoniazid, Ethambutol, Pyrazinamide and 4 months continuation phase treatment with Rifampicin and Isoniazid given 3 times per week. If there is no subscript, it means the drugs are given daily.
Usual anti-TB regimens are:
2RHEZ/4RH3 (in less endemic areas)
2RHEZ/4RH (mostly practised, especially in non-endemic areas including UK); standard recommended regimen 24
2RHEZ/7RH (in most endemic areas)
2RHEZ/10RHE (in cases of disseminated, bone and CNS tuberculosis)
2nd Line Drugs 25 & 26: These are less effective than 1st line drugs, have more toxic side effects and are usually not available in most of the developing countries of the world. There are 6 classes of 2ndline anti-TB drugs:
3rd Line Drugs: These are drugs which may be useful, but are not on the WHO list of second line drugs. These are not as effective. 3rdline drugs include:
Rifabutin (this is an effective drug but is very expensive for developing countries, so it not included in WHO list). Occasionally this can be used for patients who are intolerant to or have bacterial resistance to Rifampicin.
Macrolides: Clarithromycin (CLR), Azithromycin
Linezolid: (LZD) not of proven efficacy
Thioacetazone (T)
Thioridazine
Arginine
Vitamin D
R207910: efficacy not proven
Indications of Steroids in the treatment of TB
Steroids should be used along with anti-TB drugs in following situations:
CNS TB (proven benefit)
TB pericarditis (proven benefit)
TB involving eye (definitely beneficial)
TB pleuritis (beneficial – 20-40mg tapered over 4-8 weeks)
Extremely advanced TB (beneficial)
TB in children (may be beneficial)
Miliary TB (beneficial)
Genitourinary TB (beneficial)
Laryngeal TB (may be beneficial – scanty evidence)
TB peritonitis (may be beneficial – scanty evidence)
Important Definitions / Terms 25, 27, 28, 29
New Case: A patient diagnosed as having TB who has never had anti-TB treatment before or had taken anti-TB treatment for less than 4 weeks.
Sputum Smear Positive Case of Pulmonary TB: A patient who has 2 out of 3 consecutive sputum samples positive for AFB.
Sputum Smear Negative Case of Pulmonary TB: A patient clinically and radiologically suspected to have pulmonary TB but with 3 consecutive sputum samples which are negative for AFB and is also culture negative for AFB.
Culture Positive Case of Pulmonary TB: A patient with 3 consecutive sputum smear samples which are negative for AFB but with at least 1 specimen positive for AFB in culture.
Short Course Therapy for TB: The short course therapy for treatment of TB includes 2RHEZ/4RH and also known as standard regimen. If PZA is not included in the regimen for treating TB, the course should be extended from 6 months to 9 months. If rifampicin is not included in treatment regimen then the length of course should be 18 months in total.
Treatment Failure:A TB patient is said to have treatment failure if they remain smear or culture positive while on treatment at the 5th month or if they were initially smear positive, became negative but then reverted to positive at the end of 5months of treatment. Another scenario is that of a patient who was initially smear negative but then becomes smear positive after 2 months of treatment. Important things to note are:
Never add a single drug to a failing anti-TB regimen
Most cases are due to non-compliance
There is a high chance of Mycobacterium developing resistance to anti-TB drugs
Relapse of TB: A patient is said to have a relapse of TB if they were treated and declared cured but is again smear or culture positive; with the same organism. If the patient gets an infection with a new MTB then they are deemed to be a new case. Because genetic analysis of the infecting MTB is required to determine if re-infection is with the same organism or a new one, it is difficult to accurately diagnose TB relapse.
TB Default Case: A TB patient who completed 1 month of anti-TB treatment, stopped the treatment, and then returns for TB treatment over 2 months after treatment was first initiated. If the patient returns within 2 months of initial treatment, then his/ her initial regimen should be continued.
Re-treatment Regimen: A patient should be a given re-treatment regimen when they relapse or are a TB default case. In highly endemic areas for TB, most authorities prefer an initial intensive phase with 5 drugs for 3 months (2 months RHEZS and 1 month RHEZ).
Chronic Case of TB: A patient is said to be a chronic case of TB, who remains sputum smear positive after 1 re-treatment course. Such patients invariably have drug resistant TB.
Extra-pulmonary TB: TB involving organs other than lungs is called extra-pulmonary TB. For the purpose of treatment and understanding, TB of the central nervous system is excluded from this classification.
Pulmonary TB: Tuberculosis involving lungs is called pulmonary TB.
CNS Tuberculosis:TB can involve the meninges, brain & spinal cord. It is called TB-meningitis, cerebritis & myelitis respectively. Standard treatment is for 12 months and steroids are mandatory. INH & PZA have 100% penetration into CSF.
Miliary Tuberculosis: This a complication of 1–3% of all TB cases. Tuberculosis involving 2 or more organs/ systems of the body is called disseminated TB or miliary TB. It is also called tuberculosis cutis acuta generalisata and tuberculosis cutis disseminate. It is a form of tuberculosis that is characterized by the wide dissemination and by the tiny size of the TB lesions (1–5 mm). Its name comes from a distinctive pattern seen on a chest X-ray of many tiny spots distributed throughout the lung fields with the appearance similar to millet seeds—thus the term "miliary" tuberculosis. Miliary TB may infect any number of organs, including the lungs, liver, and spleen.
MDR-TB: Multi-drug Resistant TB (MDR-TB) is defined as TB caused by mycobacterium tuberculosis resistant to isoniazid and rifampicin. The diagnosis and appropriate treatment of MDR-TB is still a major challenge.
XDR-TB: Extensively-drug Resistant TB (XDR-TB) is defined as TB caused by mycobacterium tuberculosis resistant to isoniazid, rifampicin, quinolones and any 1 of 3 injectables: kanamycin, capreomycin or amikacin.
Treatment Categories of TB Patients:
There are four treatment categories of TB patients for details see table 1.
Table 1
Treatment Category
Type of TB Patient
Category I
New sputum smear +ve or Smear –ve pulmonary TB cases with extensive parenchymal involvement New severe extra-pulmonary TB cases
In this programme a trained person observes the patient swallowing tablets for preferably the whole course of treatment or at least the initial 2 months of treatment. Daily or thrice weekly dosages are recommended but twice weekly dosages are not recommended because of the risk of omitting (by mistake or by chance) one dose. This would result in once weekly dose and it is not acceptable. WHO recommends the DOTS strategy in an attempt to control tuberculosis. There are 5 main points of action:
Government commitment to control TB
Diagnosis based on sputum smear microscopy tests done on patients who actively report TB symptoms
Direct observation short course chemotherapy treatment
Definite supply of drugs
Standardized reporting and recording of cases and treatment outcomes
DOTS-Plus:
WHO extended the DOTS programme in 1998 to include treatment of MDR-TB and this is called DOTS-Plus. It requires the capacity for drug susceptibility testing and provision of 2nd line anti-TB drugs with facilities for identification and drug sensitivities.
Latent TB Infection (LTBI):
A patient is said to have LTBI when he is infected with MTB but does not have any symptoms and signs suggestive of active TB and has a normal chest X-ray. Such patients are non-infectious but 10% of these persons go on to develop active TB in their life at a later stage. They have positive tuberculin skin test and positive Interferon Gamma Release Assay (IGRA) tests (e.g. T-SPOT.TB test, QuantiFERON-TB Gold &QuantiFERON-TB Gold-in tube tests). There are different regimens for treatment of LTBI, commonly used are the following:
9H; 9 months INH (gold standard – only practised in USA)
6H; 6 months INH
3RH; 3 months INH + RMP (recommended in UK)
Common Causes Of Rising Burden Of Tuberculosis
The following are a few causes of rising burden of TB globally:
Non-compliance with medication
Presence of drug resistant strains of mycobacteria
Faulty regimens
Un-diagnosed cases
Under-diagnosed cases
Lack of newer, more effective anti TB medication.
Role Of Pcr In The Diagnosis Of Tuberculosis
There have been a number of studies regarding the role of PCR in the diagnosis of TB. They show that it has a high sensitivity and specificity but gold standard is still tissue smear and culture for AFB. In certain scenarios PCR of different tissue samples (pulmonary or extra-pulmonary) urine, CSF, sputum and blood can be useful and can also tell us about mycobacterial rifampicin resistance.
Role Of Physicians In Prevention & Control Of Tuberculosis In Relation To Airtravel30
Inform all patients with infectious TB that they must not travel by air on a flight exceeding 8 hours until they have completed at least 2 weeks of adequate therapy.
Inform all patients with MDR-TB and XDR-TB that they must not travel by air until they are culture-negative.
Advise patients with TB who undertake unavoidable air travel of less than 8 hours’ duration to wear a surgical mask or to otherwise keep the nose and mouth covered when speaking or coughing during the flight. This recommendation should be applied on a case-by-case basis and only with the agreement of the airline(s) involved and the public health authorities at departure and arrival.
Inform relevant health authorities of the intention of a patient with infectious TB to travel against medical advice.
Inform relevant health authorities when a patient with infectious TB has a recent history of air travel (travel within 3 months).
Side Effects Of Medications Used For Treatment Of Tuberculosis31, 32, 33, 34
Patients who are on treatment for TB should be monitored regularly for any signs of medication toxicity. This may include blood tests in addition to clinical examination. Common side effects of the routinely used 4 anti-TB medications (INH, rifampicin, Ethambutol & PZA) are as follows:
Hepatotoxicity: INH, PZA and rifampicin are known to cause liver toxicity. Ethambutol is a safer medication in patients with known liver problems. INH is contraindicated in patients with active hepatitis and end stage liver diseases. 20% patients can have an asymptomatic rise in AST concentration in the first 3 months of therapy. Symptoms of liver toxicity include anorexia, nausea, vomiting, dark urine, jaundice, fever, persistent fatigue, abdominal pain especially in the right upper quadrant. Routine base line LFTs are recommended prior to starting treatment. After that they should be repeated at least once a month and more frequently in those who are at risk of developing hepatotoxicity. Patients at increased risk of hepatotoxicity include:
HIV positive
Pregnant or post-partum (3 months after delivery)
History of or at risk of chronic liver disease (daily use of alcohol, IV drug users, hepatitis, liver cirrhosis)
Patients taking any other medication which have potential hepatotoxic side effects
The risk of hepatotoxicity increases with age (> 35 years old)
Suspect drug induced liver injury if there is AST/ ALT rise > 3 times base line with symptoms or > 5 times in the absence of symptoms, or disproportionate rise in ALP and total bilirubin. In such a situation:
Stop hepatotoxic anti-TB medications (INH, rifampicin and PZA) immediately
Admit the patient to hospital
Carry out serological tests for Hepatitis A, B, and C (particularly in those who are at risk for hepatitis)
Look for other causes (hepatotoxic medications, high alcohol consumption)
In acutely ill smear or culture positive patients start liver friendly medications i.e. Ethambutol Quinolones, and Streptomycin, until the cause for hepatotoxicity is identified.
Re-challenge: Once LFTs are normal (or < two times the upper normal limit) start with Ethambutol and add INH 1st. If LFTs do not rise after 1 week add Rifampicin. Next add PZA if there is no rise in LFTs after 1 week of adding Rifampicin. If at any point LFTs increase or symptoms recur, stop the last added drug – as this is the culprit drug.
Gastro-intestinal (GI) upset: GI upset is quiet common with anti-TB medications and usually occur in the first few weeks of therapy. Symptoms usually are nausea, vomiting, anorexia, abdominal pain. In such a case recommend good hydration, change the timing of medication (advise to take with a light snack and at bed time) and also check LFTs for possible hepatitis. Aluminium salt containing antacids can reduce bioavailability of INH, so avoid them 1 hour before and 2 hours after INH administration.
Rash: All anti-TB medications can cause a skin rash. Management is based on severity:
Mild rash or itching: administer anti-histamines 30 minutes prior to anti-TB medications and continue with the therapy. If no improvement, add prednisolone 40mg/day and gradually taper down when the rash clears.
Petechial rash: Red pinpoint sized dots under the skin due to leakage from capillaries – suspect rifampicin hypersensitivity. Monitor LFTs and full blood count. If platelet count is below normal (base line), stop rifampicin and do not restart it.
Erythematous rash with fever: and/ or mucous membrane involvement; stop all anti-TB medications immediately and hospitalize the patient. Rule out anaphylaxis (angio-oedema, swollen tongue, throat, stridor, wheezing, flushed face, hypotension) and Stevens-Johnson Syndrome (systemic shedding of mucous membranes and fever). If situation does not permit to stop TB medication then try 3 new drugs i.e. aminoglycoside and 2 oral agents from second line. Once the rash has settled, can re-introduce first line TB medications one by one every 2-3 days, 1st rifampicin, then INH, then PZA and then Ethambutol. While re-introduction, monitor the signs and symptoms of rash, if rash recurs at any point remove the last agent added.
Peripheral neuropathy: signs and symptoms include numbness and tingling in feet and hands, increased sensitivity to touch and stabbing pain. INH can cause peripheral neuropathy. It is more common in malnourished people, diabetes, HIV, renal failure, alcoholism, pregnancy and in breast feeding women. Prevention is the key; prophylaxis is with Pyridoxine (vitamin B6) 10mg/ 100mg INH (normally 25 – 50mg) per week is used in high risk patients.
Optic neuritis: the main agent responsible for this is Ethambutol. It is dose related and gets more intense if treatment is continued. Signs and symptoms are difficulty in reading road signs, decreased red-green colour discrimination, blurring or vision, and colour blindness. These can be unilateral or bilateral. Ethambutol is not recommended in children <5 years of age as visual changes are difficult to monitor. Visual acuity and colour blindness tests are recommended at baseline and also on a monthly basis. Fluctuations of 1 or 2 lines on the Snellen chart is considerable and Ethambutol must be stopped. More than 10% visual loss is considered significant.
Fatigue: INH can cause fatigue and in such situations patients should take the medication at bedtime. If it continues, check LFTs to look for hepatotoxicity.
Flu-like symptoms/joint aches and pains: These are usually seen with Rifampicin and treatment is symptomatic.
Drug-induced lupus: It is seen with INH and blood tests should be done to differentiate it from SLE. It can be managed with steroids while the patient is taking INH.
Irritable bowel syndrome (IBS) is a chronic and often debilitating condition with a complex aetiology1. It is the most common diagnosis made by gastroenterologists worldwide2. The incidence and prevalence of IBS vary depending on the diagnostic criteria used but it is estimated that the prevalence in the UK is 17% overall, with a prevalence of 11% among men and 23% among women3-4. IBS can have a significant negative impact on quality of life and social functioning, although it is not known to be associated with the development of serious disease or excess mortality. However, patients with IBS are more likely to undergo specific surgical operations such as hysterectomy and cholecystectomy. IBS further represents an economic burden on society due to the high consumption of healthcare resources and the non-productivity of IBS patients5. It appears that 33–90% of patients do not consult a physician, and that a proportion of patients who meet the IBS criteria are not diagnosed with IBS. The frequency of IBS symptoms peaks in the third and fourth decades, and there is a female predominance of about 2:1 in the 20s and 30s, although this discrepancy is less apparent in older patients6. The female predominance is less apparent in the general population, which suggests that women with IBS are more likely to seek healthcare for their symptoms7. IBS symptoms which persist beyond middle life continue to be reported by a substantial proportion of individuals in their seventh and eighth decades.
Pathogenesis
The pathogenesis of IBS appears to be multifactorial. The following factors play a central role in the pathogenesis: heritability and genetics, dietary and intestinal microbiota, low-grade inflammation and disturbances in the neuroendocrine system of the gut2.
IBS is known to aggregate in families and to affect multiple generations but not in a manner consistent with a major Mendelian effect. Relatives of an individual with IBS are two to three times as likely to have IBS8.
Psychological distress is not only a common co-morbidity in IBS patients, but also a factor which is likely to play a direct role in the pathogenesis4. Interestingly, parental modelling and the reinforcement of illness behaviour can also contribute to IBS. Having a mother with IBS has been shown to account for as much variance as having an identical set of genes as a co-twin who has IBS. This insinuates that the contribution of social learning to IBS is at least as great as the contribution of heredityFurthermore, the role of childhood events such as nasogastric tube placement, poor nutrition, abuse, and other stressors have been clearly associated with IBS8.
A substantial proportion of patients with IBS report onset of their symptoms after acute gastroenteritis9. Post-infectious (PI)-IBS has been reported after viral, bacterial, protozoa and nematode infections, with the incidence of PI-IBS varying between 7% and 31%. In this subset of IBS patients GI symptoms appear following gastroenteritis, with approximately 10% developing persistent symptomsRecent studies suggest that some individuals are genetically predisposed to developing PI-IBS, with some people demonstrating a specific cytokine response to infection4.
It is important to note that women appear to have more frequent and severe IBS symptoms during menses compared to other phases of the menstrual cycle and that female gender is a significant independent risk factor for the development of IBS7.
Diagnosis and Investigations
Adult patients who present to their general practitioner (GP) with lower gastrointestinal tract disorders account for one in 20 of all general practice consultations. The possibility of sinister conditions such as colorectal cancer or inflammatory bowel disease may create diagnostic uncertainty and reluctance for the doctor to attribute the symptoms to IBS. In the United Kingdom up to 29% of patients with IBS are referred to a specialist but the majority of these will return to their GP for long term management6.
Primary care differs from specialist care because the GP’s greater familiarity with the patient, and their previous consultations, enable presenting problems to be seen in context rather than in isolation. Furthermore, it involves the first contact for care of problems at a stage when they are likely to be poorly defined. Lastly, primary care is characterised by a biopsychosocial model of care that takes into account the context of the person’s problem. These characteristics are especially important when managing chronic disorders, such as IBS, where there is a high priority on continuity of care6.
There is currently no biochemical, histopathological or radiological diagnostic test for IBS. The diagnosis is based principally on symptom assessment. The Rome III criteria (Figure 1) is the most recent, updated and universal diagnostic criteria for IBS. However, although the Rome III criteria are widely used in clinical studies, it is not used by most cliniciansIn fact, most primary care physicians are not aware of diagnostic criteria for IBS and about one third of secondary care doctors do not use them in practice6.
IBS patients are grouped on the basis of the most predominant bowel symptom as diarrhoea- predominant, constipation-predominant, a mixture of both diarrhoea and constipation, and un-subtyped IBS in patients with an insufficient abnormality of stool consistency to meet the criteria for the other sub-groups. Approximately one third of patients have diarrhoea- predominant, one third have constipation-predominant, and the remainder have a mixture of both diarrhoea and constipation. The classification of IBS patients into sub-groups is useful for clinical practice, but it is common for IBS patients to switch from one subtype to another over time. More than 75% of IBS patients change to either of the other 2 subtypes at least once over a 1-year period2,10.
Figure 1 - Rome III diagnostic criteria* for IBS 6
Recurrent abdominal pain or discomfort** at least 3 days a month in the past 3 months, associated with two or more of the following:
Improvement with defecation
Onset associated with a change in frequency of stool
Onset associated with a change in form (appearance) of stool
* Criteria fulfilled for the past 3 months with symptom onset at least 6 months before diagnosis
** “discomfort” means an uncomfortable sensation not described as pain
According to the National Institute for Health and Clinical Excellence (NICE), healthcare professionals should consider assessment for IBS if a patient presents with any of the following symptoms for at least six months11:
abdominal pain/discomfort
bloating
or a change in bowel habit
NICE has also given the following guideline pertaining to “red flag” indicators. All people presenting with possible IBS symptoms should be asked if they have any of the following indicators. Referral to secondary care should be made if any are present11:
unintentional and unexplained weight loss
rectal bleeding
family history of bowel or ovarian cancer
change in bowel habit to looser and/or more frequent stools persisting for more than 6 weeks in a person aged over 60 years.
Furthermore, all patients presenting with IBS symptoms should be appropriately assessed and clinically examined for the following 'red flag' indicators. A referral should be made to secondary care if any are present11:
Anaemia
Abdominal masses
Rectal masses
Inflammatory markers for inflammatory bowel disease
Serum CA125 should be measured in women with symptoms that suggest ovarian cancer
In addition, NICE have stated that IBS should be considered only if the person has abdominal pain or discomfort that is either relieved by defecation or associated with altered bowel frequency or stool form. This should be accompanied by at least two of the following four symptoms11:
abdominal bloating (more common in women), distension, tension or hardness
symptoms made worse by eating
passage of mucus
Other features such as lethargy, nausea, backache and bladder symptoms are common in people with IBS, and may be used to support the diagnosis.
According to NICE, patients who meet the IBS diagnostic criteria should have the following tests to exclude other diagnoses (Figure 2):
Figure 2 11 - Tests to exclude other diagnoses
Full blood count (FBC)
Erythrocyte sedimentation rate (ESR) or plasma viscosity
C-reactive protein (CRP)
Antibody testing for coeliac disease (endomysial antibodies [EMA] or tissue transglutaminase [TTG])
The value of serological tests for coeliac disease (EMA or TTG antibodies) in patients with IBS diarrhoea-predominant depends on the population and is generally considered cost-effective if the incidence of coeliac disease is above 1%. It is therefore likely to be beneficial in the United Kingdom, where up to 3% of cases of IBS diarrhoea-predominant in primary care have coeliac disease6.
The following tests are not necessary to confirm diagnosis in people who meet the IBS diagnostic criteria11:
Ultrasound
Rigid/flexible sigmoidoscopy
Colonoscopy/barium enema
Thyroid function test
Faecal ova and parasite test
Faecal occult blood
Hydrogen breath test (for lactose intolerance and bacterial overgrowth)
It is important to note that IBS is associated with several other conditions. At least half of IBS patients can be described as depressed, anxious, or hypochondriacal. In addition, between 20% and 50% of IBS patients have fibromyalgia. Furthermore, IBS is common in several chronic pain disorders, being present in 51% of patients with chronic fatigue syndrome, in 64% with temporomandibular joint disorder, and in 50% with chronic pelvic pain. The lifetime rates of IBS in patients with these syndromes are even higher. Patients with such co-morbidities generally have more severe IBS. A careful history to identify such associated disorders is helpful in identifying patients who are likely to have severe IBS and associated psychiatric disorder6.
Management
The treatment of IBS is determined by the patient’s most troublesome symptoms. Although there is overlap in the therapies offered to the different IBS sub-groups, treatment decisions are primarily based on the frequency and severity of symptomsThe management discussed in this section is largely based on the NICE guidelines11.
Dietary and lifestyle advice
People with IBS should be given information about the importance of self-help in effectively managing their IBS. This should include information on general lifestyle, physical activity, diet and symptom-targeted medication. Healthcare professionals should assess the physical activity levels of people with IBS (ideally using the General Practice Physical Activity Questionnaire). People with low activity levels should be given advice to encourage them to increase their activity levels. Healthcare professionals should also encourage people with IBS to make the most of their available leisure time and to create time for relaxation11.
Figure 3 summarises the general advice that should be given to patients regarding their diet and nutrition. If diet continues to be considered a major factor in a person's symptoms and they are following general lifestyle/dietary advice, they should be referred to a dietician for further advice and treatment, including single food avoidance and exclusion diets. Such advice should only be given by a dietician11.
Probiotics are live microorganisms which when taken in sufficient quantities, confer a health benefitPeople with IBS who try probiotics should be advised to take the product for at least 4 weeks while monitoring the effect. Probiotics should be taken at the dose recommended by the manufacturer11.
Figure 3 - Diet and nutrition should be assessed and the following general advice given 11
Have regular meals and take time to eat
Avoid missing meals or leaving long gaps between eating
Drink at least eight cups of fluid per day, especially water or other non-caffeinated drinks, for example herbal teas
Restrict tea and coffee to three cups per day
Reduce intake of alcohol and fizzy drinks
It may be helpful to limit intake of high-fibre food (such as wholemeal or high-fibre flour and breads, cereals high in bran, and whole grains such as brown rice)
Reduce intake of 'resistant starch' (starch that resists digestion in the small intestine and reaches the colon intact), which is often found in processed or re-cooked foods
Limit fresh fruit to three portions per day (a portion should be approximately 80 g)
People with diarrhoea should avoid sorbitol, an artificial sweetener found in sugar-free sweets (including chewing gum) and drinks, and in some diabetic and slimming products.
People with wind and bloating may find it helpful to eat oats (such as oat-based breakfast cereal or porridge) and linseeds (up to one tablespoon per day).
Healthcare professionals should review the fibre intake of patients, adjusting (usually reducing) it while monitoring the effect on symptoms. People with IBS should be discouraged from eating insoluble fibre (for example, bran). If an increase in dietary fibre is advised, it should be soluble fibre such as ispaghula powder or foods high in soluble fibre (for example, oats)
Pharmacological therapy
Healthcare professionals should consider prescribing antispasmodics for patients. These should be taken as required, alongside dietary and lifestyle advice. Laxatives should be considered for the treatment of constipation, but patients should avoid taking lactulose. Patients should be advised how to adjust their doses of laxative or antimotility agent according to the clinical response. The dose should be titrated according to stool consistency, with the aim of achieving a soft, well-formed stool (corresponding to Bristol Stool Form Scale type 4). Loperamide should be the first choice of antimotility agent for diarrhoeaOne advantage of loperamide is its peripheral site of action with little penetration of the blood brain barrier and thus, little potential for CNS side effects or habituation4.
Psychotropics possess a variety of peripheral and central effects which make them attractive treatments for IBS. These effects include modulation of pain perception, mood stabilisation, treatment of associated psychiatric conditions, and possible direct effects on GI motility and secretionHealthcare professionals should consider tricyclic antidepressants (TCAs) as second-line treatment for patients if laxatives, loperamide or antispasmodics have not helped. Treatment should be started at a low dose (5–10 mg equivalent of amitriptyline), which should be taken once at night and reviewed regularly. The dose may be increased, but does not usually need to exceed 30 mg11.
Selective serotonin reuptake inhibitors (SSRIs) should be considered only if TCAs have been ineffective. The anticholinergic effects of TCAs and their ability to prolong intestinal transit times are the reasons they are particularly preferred over SSRIs in IBS diarrhoea-predominant. Furthermore, given the propensity of SSRIs to commonly cause GI adverse events of nausea, vomiting, and diarrhoea, indicate that TCAs may have more utility in IBS diarrhoea-predominant than SSRIs12. Healthcare professionals should take into account the possible side effects when prescribing TCAs or SSRIs. After prescribing either of these drugs for the first time at low doses, the patient should be followed up after 4 weeks and then at 6–12 monthly intervals11.
Psychological interventions
Anxiety and depression are common in IBS and patients report a correlation between stress and their symptoms, providing a rationale for psychological therapyReferral for psychological interventions (cognitive behavioural therapy, hypnotherapy and/or psychological therapy) should be considered for people with IBS who do not respond to pharmacological treatments after 12 months and who develop a continuing symptom profile (refractory IBS).11 Hypnotherapy reduces patient anxiety and improves symptom control in the majority of patients with refractory IBS. The benefits extend well beyond symptom control and include improvements in quality of life and reduction in emotional distress13. Data from general practice shows that hypnotherapy is effective during the first three months, although the effect is less marked after that6.
Prognosis of IBS depends on the length of the history, those with a long history being less likely to improveFollow-up should be agreed between the healthcare professional and the patient based on the response of the person's symptoms to interventions. The emergence of any 'red flag' symptoms during management and follow-up should prompt further investigation and/or referral to secondary care11.
Grapefruit (Citrus paradise) is thought to have originated as a cross between the Jamaican sweet orange (Citrus sinensis) and the Indonesian pomelo (Citrus maxima) fruit. It was first bred in Barbados and brought to Florida in 1820s. Subsequently, different mutant and hybrid varieties were developed. Although the white and pink varieties were being popularly consumed, the ruby red variety has become very popular and commercially successful.
The taste is a mixture of the sweetness and tanginess of an orange and the sourness of a citrus fruit. It is a rich source of vitamins C and potassium. It is found to have antioxidant properties due to the presence of lycopene1and an ability to inhibit atherosclerosis due to the presence of pectin2,3. The seed extract is thought to have antimicrobial and antifungal properties.
With good publicity, marketing and coverage by health magazines, grapefruit juice has gained widespread use and in most Western Europe and America it is one of the common fruit juices consumed at breakfast. In the United Kingdom, in terms of fruit juice sales, it ranks second among citrus fruits and the fourth overall.4
Pharmacokinetic effects
The interaction of grapefruit juice with medication was first reported by Bailey et al in 1991 after their accidental discovery of up to four fold increase in the blood levels of filodipine when taken with grapefruit juice5. Further studies have identified similar interactions with more than 85 drugs6. The half life of the effects of grapefruit juice is estimated to be around 12 hours7, but these effects may last from 4 hours to 24 hours8. The effects are more pronounced with regular consumption of grapefruit juice prior to ingestion of the drug and there can be a cumulative increase in drug concentrations with continued grapefruit juice intake7,9.
As little as 200-250ml may be sufficient to induce its effects7,10. Some of the interactions involve medication that have narrow therapeutic window and can therefore cause potent adverse effects such as torsade de pointes, rhabdomyolysis, myelotoxicity, respiratory depression gastrointestinal bleeding, nephrotoxicity and sudden cardiac death.6 There is a lack of awareness among both doctors and patients about its effects and interaction with various medications.
Mechanism of action
These pharmacokinetic interactions with grapefruit juice are more observable in drugs with high first pass metabolism and in those with an innate low oral bioavailability. The oral bioavailability of affected drugs is increased but their half life usually remains unaltered11,12. Grapefruit juice is associated with the inhibition of Cytochrome P450 enzyme system, particularly the CYP3A4 enzyme7. The CYP3A4 enzyme is present both in the liver and intestinal mucosa. Once the drug is taken up by the mucosa, the susceptible drug may be metabolised by the CYP3A4 or pumped back into the intestine lumen by P-glycoprotein. The observed effects of grapefruit juice are thought to be mainly due to the inhibition of intestinal CYP3A4 activity, which leads to decreased first pass metabolism and hence increased bioavailability. This inhibitory action is fairly quick and may be due to the rapid degradation of the enzyme or any decrease in its production from the mRNA. The production of mRNA itself from DNA is not thought to be affected13. The susceptibility varies between individuals depending upon their genetic expression of CYP3A4, the effects being more prominent in those with high small intestinal CYP3A4 content7, 14.
The effect of grapefruit juice on the P-glycoprotein is unclear. The activation of P-glycoprotein pumps the drug back into the intestinal lumen which should reduce bioavailability and similarly the inhibition of P-glycoprotein increases the bioavailability. Some studies suggest that the inhibition of P-glycoprotein is the mechanism responsible for the increased bioavailability of certain drugs like cyclosporine15,16.
The active ingredients responsible for interactions of grapefruit juice with medication are not clearly identified. The compounds exerting this action are thought to be either the flavanoids such as naringin and naringinen17,18,19,20 or the furanocoumarins such as bergamottin and its derivatives21,22,23,24, but there is no clear consensus.
Drug interactions
Table 1 below lists some of the commonly used drugs whose bioavailability is affected by grapefruit juice. Although the best known interactions have been mentioned in the table, there are many other drugs like carvedilol, estrogens, itraconazole, losartan and methyl prednisolone whose bioavailibility is increased by grapefruit juice and the adverse effects are not yet clear.
Table 1: Potential risk of drug interactions with grapefruit juice6, 7,13,25,26,27
Risk of Interaction
Group
Drug
V High
High
Mod
Anaesthetic
Ketamine
+++
Anaesthetic
Alfentanil
++
Fentanyl
++
Antiarrhythmic
Dronedorone
+++
Amiodorone
++
Quinidine
+
Anti-Cancer
Dasatanib
++
Everolimus
++
Nilotinib
++
Pazopanib
++
Sunitinib
++
Vanetanib
++
Antidepressants
Buspirone
++
Sertraline
+
Clomipramine
+
Antiemetic
Domperidone
+++
Antiepileptics
Carbamazapine
++
Anti-HIV
Maraviroc
+++
Ripivirine
++
Anti-infective
Erythromycin
++
Quinine
++
Primaquine
++
Antiplatelet
Clopidogrel
++
Antipsychotics
Pimozide
++
Quetiapine
++
Ziprasidone
++
Benzodiazepines
Midazolam
+
Diazepam
+
Triazolam
+
Ca-channel bolckers
Felodipine
+
Nifedipine
+
Immunosuppressants
Cyclosporin
++
Tacrolimus
++
Sirolimus
++
Opiods
Oxycodone
++
Methadone
++
Statins
Simvastatin
+++
Atorvastatin
++
Urinary Tract
Solifenacin
+
Fesoterodine
+
Darifenacin
+
Tamsulosin
+
Implications on clinical practice
Clinicians should make themselves aware and educate their patients of these potential interactions, keeping in mind the individual variations in susceptibility. This may be particularly important for medications that have a very narrow therapeutic window, medication that have an innate low oral bioavailability and a high first pass metabolism mainly via CYP3A4.
A patient may develop exceptional beneficial effects or equally, significant adverse effects should he start consuming grapefruit juice mid- treatment. Conversely, a drop in efficacy of a drug is also possible, should a patient using grapefruit juice on a regular basis, stops it suddenly.
To achieve steady concentration of the medication and avoid such potential effects, it may be best to advise patients to avoid consuming grapefruit juice if there is a potential of interaction. The half life of the effect of grapefruit juice appears to be around 12 hours and therefore, it is advisable to discontinue grapefruit juice 72 hours prior to starting any drug with potential interactions. 8,9
Due to the prolonged effect of CYP3A4 inhibition which may last up to 24 hours, it is not possible to avoid these interactions by separating the times of drug and grapefruit juice consumption.8,9
There is more research needed to clarify the mechanism of action and to determine the active ingredients. The identification of the active ingredient can allow oral administration of drugs that undergo CYP3A4 mediated high first pass metabolism because of which currently, they can only be given systemically.
In light of the possible increase in bioavailability of specific drugs, although it might be possible for patients to use this to their advantage in reducing the dose of their medication under medical supervision, it is perhaps too early to recommend the use of grapefruit juice as an adjunctive or augmentation strategy.
The incidence and prevalence of hypertension is rife among first and second world countries and arguably, could be labelled the most common chronic disease in the UK1. It is estimated that a quarter of all adults in the UK have hypertension2. This is alarming in light of the incredible contribution of hypertension to mortality and morbidity. Evidence shows that for each 2mmHg rise of systolic blood pressure, mortality from ischaemic cardiac events rises by 7% and mortality from ischaemic intracranial events rises by 10%3-4. The key to reversing this lies in diagnosing hypertension accurately and quickly and knowing how to best treat each patient.
Understanding hypertension
It is still not entirely clear what mechanisms cause hypertension. Evidence has proven that systolic blood pressure increases in a linear fashion with age, which is due to the loss of elastic tissue in arteries with age1,5. This is known as ‘essential hypertension’. The majority of patients who are diagnosed with hypertension have ‘essential hypertension’, in other words, there is no clear cause found besides increasing age1-2. Research has shown that other factors can be associated with hypertension but alone may not necessarily cause it. Unalterable risk factors include genetic predisposition, age, sex and race. Other factors which have proven to raise blood pressure include environmental factors such as lifestyle and diet, obesity (randomised control trials have shown that a weight loss of one kilogram can be attributed to one mmHg fall in diastolic blood pressure5), excessive alcohol intake, smoking, stress at work or in the home, socio-economic status and recent major life events1-2,6.
How to take the perfect blood pressure
In the clinic setting, make sure the patient is relaxed, sit the patient comfortably with their arm outstretched, resting on the table and wait a few minutes. Make sure the sleeves are not too tight as this will alter the readings1,5. Be careful that the blood pressure cuff is the correct size for the patient as small cuffs can give a false high reading for larger patients and larger cuffs can give a false low reading for smaller patients3,5. Check the pulse is regular as irregular pulses can give incorrect readings from automated devices - if in doubt perform it manually5. Take the blood pressure in both arms and repeat several times, discard the first reading and always record the lowest reading in the patient’s file1.
The well recognised ‘white coat syndrome’ has a prevalence of about 10% in the UK and according to NICE data, the syndrome can cause a difference of 20/10mmHg between readings in a clinical setting and those at home1,3,5. In light of this, NICE altered the guidelines in 2011, stating that any patient with a reading close to 140/90mmHg is to be sent home with an Ambulatory Blood Pressure Monitor (ABPM)3. This is a device attached to the patient for a minimum of 24 hours and it records the patient’s blood pressure every 30 minutes of the patient’s waking day. The idea behind this is to rule out any ‘white coat syndrome’ and to get a range of readings as the patient goes about their usual day to day activities. In this way, when the readings are analysed (an average of at least 14 readings are taken by the clinician), it confirms diagnosis immediately and treatment can be initiated1,3.
The value of repeated measurements in different settings has been shown in evidence from as early as the 1970s2,5. Research has also shown that patients usually have a high blood pressure reading initially which drops after subsequent measurements, hence the new guidelines are in place to allow for a range of readings before diagnosing and treating hypertension1,3.
Investigations
While the patient is still in the clinic, assess the patient’s overall cardiovascular risk score using the cardiovascular risk assessment tool3. Perform a thorough physical examination, including looking for evidence of target organ damage, for example, left ventricular hypertrophy, renal disease, peripheral vascular disease and changes in the retina from raised blood pressure1,3,5. If there is suspicion of hypertension, send the patient home on an ABPM3. While waiting for the results of the ABPM, any patient under investigation for hypertension needs to have a baseline set of tests1,7-8. This includes a full blood count, renal function tests, liver function tests, a fasting glucose and cholesterol blood test, an ECG (electrocardiogram) and a urine dip. These tests are a basic screen for assessment of target organ damage6,9. If these investigations are not adequate, a patient can be referred for more extensive investigation for target organ damage, for example, an echocardiogram or a renal ultrasound/angiography1,3,5.
Any patient that is young or presenting with persistent hypertension, especially that which does not respond to treatment, needs further investigation for other causes, such as renal disease, adrenal disease, alcoholism or steroid use (not to forget the oral contraceptive pill can also cause hypertension1,7,9.
In general, a patient should be treated if their blood pressure readings are persistently 140/90mmHg or higher. For those that have borderline readings, for example, 135/85mmHg, clinicians must assess their cardiovascular risk score and look for target organ damage. If there is evidence for either of these, a patient should be started on treatment immediately1.
Treatment
Non-pharmacological
First line treatment of hypertension is always non-pharmaceutical; also known as ‘lifestyle changes’ 1,3,5,9. Attempt to find out the details of the patient’s diet, weight, employment, stress levels at work/home, exercise, alcohol intake and smoking habits. Once established, assist the patient in altering their lifestyle choices in order to lower their blood pressure. Patients often feel overwhelmed and many benefit from group activities, such as smoking cessation and weight loss groups3. Other ideas include a dietician referral, counsellors if they are struggling with motivation and low moods, gym sessions/personal trainers. Encourage the patient in that if they succeed in altering their lifestyle and therefore bringing down their blood pressure, they can avoid prescription medication.
Lifestyle changes can delay hypertension for many years but if the blood pressure continues to creep upwards in subsequent multiple visits and lifestyle options have been exhausted, it would then be appropriate to start pharmacological management1,3,5.
Pharmacological Treatment
In general terms, always start with monotherapy and increase the dose according to patient response. According to NICE guidelines from 2011, if a patient is over 55 years of age and/or Afro-Caribbean in origin, start with a calcium channel blocker, such as Amlodipine3. If these are contra-indicated, start with a thiazide diuretic3. In regards to thiazide diuretics, the new NICE guidelines state that Chlortalidone (12.5–25.0 mg once daily) or Indapamide (1.5 mg modified-release or 2.5 mg once daily) should be used in preference to what clinicians have been prescribing for years, namely Bendroflumethiazide and Hydrochlorothiazide3. For those who are already on these conventional thiazide diuretics, NICE state that if the patient’s blood pressure is stable, to continue with Bendroflumethiazide or Hydrochlorothiazide3.
Patients diagnosed with hypertension who are under 55 years of age, should be started on an ACE inhibitor (Angiotensin Converting Enzyme inhibitor), for example, Ramipril3, but if this is not tolerated, replace it with an ARB (Angiotensin II Receptor Blocker) such as Losartan3.
Review the patient every few weeks initially and extend the reviews to 6 months once the blood pressure is within therapeutic range6.Do not forget to check the patient’s renal function in the first few months of starting a new drug and always be aware that if a patient’s blood pressure drops drastically after starting an ACE inhibitor this suggests underlying renal disease and must be investigated1,3,5,9.
Continue to titrate the dose of the drug until the patient’s blood pressure is satisfactory. Consider adding in a second agent when the patient is nearing maximum dose of the first agent and the blood pressure is rising again3,5. Depending on what the patient is on, add in either an ACE inhibitor, ARB or a calcium channel blocker, for example, if patient is on Ramipril, add in Amlodipine and vice versa3. If a calcium channel blocker is not tolerated as second line, consider using thiazide diuretics. Afro-Caribbean patients who are already on calcium channel blockers, add in an ARB, rather than an ACE inhibitor3.
Following that, if the blood pressure is still not within therapeutic range, consider adding in a third agent or alternatively, discontinue the first agent and continue with the second and add a third from among an ACE inhibitor, ARB or calcium channel blocker. Consider a thiazide diuretic if patients are intolerable to any of the above3.
Beta-blockers should not be considered in treating hypertension, according to NICE, unless the patients are very young or intolerant to ACE inhibitors, ARBs or calcium channel blockers3.
Beware and monitor closely any elderly patients who are on antihypertensives as the physiology of ageing interferes with the drugs, for example, decreased clearance of drugs from the kidney or liver, decreased sensitivity to baroreceptors (postural hypotension), chronic sodium retention and reduced cardiac reserve. Do not forget communication and compliance issues with the elderly also1,7.
Make sure there is an annual review for each patient that has been diagnosed with hypertension in order to get blood pressure readings, medication review and how the patient is coping with lifestyle changes or side effects of the antihypertensives.
When to Refer
Resistant hypertension is defined as a patient remaining hypertensive despite being on triple or quadruple drug therapy3,7. Consider starting a low dose of Spironolactone (if the serum potassium is less than 4.5mmol/l) and refer to a specialist for advice3-4.
If subsequent readings are 180/110mmHg or more, start antihypertensives immediately and refer the patient to hospital. Also refer immediately if retinal haemorrhages or papilloedema are seen1,3.
Summary
If a patient is suspected to have hypertension, send them home with an ABPM and perform baseline tests1,3.
Start treatment if blood pressure is 140/90mmHg and ABPM average is 135/85mmHg and/or patient has one of the following:
target organ damage
established cardiovascular disease
renal disease
diabetes
10-year cardiovascular risk equivalent to 20% or greater (NICE guidelines, 2011)3
Start on monotherapy and review every few months, until blood pressure is stable3.
Review yearly after stability has been reached and consider adding in further antihypertensives if the blood pressure rises again.
Book patients in for annual reviews of end organ damage as this is an excellent overview of disease progression.
Hypertension is to be respected in light of its incredible contributor to morbidity and mortality. Never underestimate the importance of keeping a patient’s blood pressure within the desired range4.
Vertigo is the hallucination of movement of the environment around the patient, or of the patient with respect to the environment 1. It is not a fear of heights.
Vertigo is not necessarily the same as dizziness
Dizziness is a non-specific term which can be categorised into four different subtypes according to symptoms described by the patients:
Vertigo
Presyncope: the sense of impending faint, caused by a reduced total cerebral perfusion
Light-headedness: often described as giddiness or wooziness 2
Disequilibrium: a feeling of unsteadiness or imbalance when standing 2
Classification Vertigo may be classified as:
Central - due to a brainstem or cerebellar disorder
Peripheral - due to disorders of the inner ear or the Vestibulocochlear (VIIIth) cranial nerve
Incidence/Prevalence: Most patients who complain about dizziness do not have true vertigo:
5 community based studies into dizziness indicated that around 30% of patients were found to have vertigo, rising to 56.4% in an older population 3
A postal questionnaire study which examined 2064 patients, aged 18-65, 7% described true vertigo in the previous year 3
A full time GP can therefore expect between 10-20 patients with vertigo in one year 3
93% of primary care patients with vertigo have either benign paroxysmal positional vertigo (BPPV), acute vestibular neuronitis, or Ménière's disease 4. These conditions are highlighted in Table 2
Causes A wide range of conditions can cause vertigo, and identifying whether deafness or CNS signs are present, can help narrow the differential diagnosis, as shown in Table 1.
Brain tumour:- e.g. ependymoma or metastasis in the fourth ventricle
Acute cochleo-vestibular dysfunction
Cervical spondylosis
Migraine
Syphilis (rare)
Following flexion-extension injury
Multiple sclerosis
Aura of epileptic attack – especially temporal lobe epilepsy
Drugs – e.g. phenytoin, barbiturates
Syringobulbia
Symptoms
Vertigo may be due to central lesions or peripheral lesions. Vertigo may also be psychogenic or occur in conditions which limit neck movement, such as vertigo caused by cervical spondylosis, or following a “whiplash” flexion-extension injury.
It is essential to determine whether the patient has a peripheral or central cause of vertigo 1.
Information obtained from the history that can be used to make this distinction includes 1:
The timing and duration of the vertigo
Provoking or exacerbating factors
Associated symptoms such as
Pain
Nausea
Neurological symptoms
Hearing loss
Central vertigo:
The vertigo usually develops gradually
Except in: an acute central vertigo is probably vascular in origin, e.g. CVA
Central lesions usually cause neurological signs in addition to the vertigo
Auditory features tend to be uncommon.
Causes severe imbalance
Nystagmus is purely vertical, horizontal, or torsional and is not inhibited by fixation of eyes onto an object
The duration of vertigo episodes and associated auditory symptoms will help to narrow the differential diagnosis 5. This is illustrated for various pathologies that cause vertigo, in Table 2
Table 2 Timing of symptoms
Pathology
Duration Of Episode
Associated Auditory Symptoms
Peripheral or Central Origin
Benign Paroxysmal Positional Vertigo
Seconds
No
Peripheral
Vestibular Neuronitis
Days
No
Peripheral
Ménière's Disease
Hours
Yes
Peripheral
Perilymphatic Fistula
Seconds
Yes
Peripheral
Transient Ischemic Attack
Seconds / Hours
No
Central
Vertiginous Migraine
Hours
No
Central
Labyrinthitis
Days
Yes
Peripheral
Stroke
Days
No
Central
Acoustic Neuroma
Months
Yes
Peripheral
Cerebellar Tumour
Months
No
Central
Multiple Sclerosis
Months
No
Central
It is important to differentiate vertigo from non-rotatory dizziness (presyncope, disequilibrium, light-headedness). Patients can be asked whether they “felt light headed or felt as if the world was spinning around” during a dizzy spell 3.
Important points in the history:
Onset - specific provoking events such as flying or trauma
Associated auditory symptoms - rare in primary CNS lesion
Other associated symptoms
Nausea and vomiting in a vestibular cause
Neurological symptoms such as visual disturbance, dysarthria in a central lesion
Physical/signs
Examination of ear drums (Otoscopy/ Pneumatic otoscopy) for:
Vesicles (Ramsay Hunt syndrome)
Cholesteatoma
Tuning fork tests for hearing loss – Rinne/Weber tests
Cranial nerve examination. Cranial nerves should be examined for signs of :
Nerve palsies
Sensorineural hearing loss
Nystagmus 3
Hennebert's sign 1
Vertigo or nystagmus caused by pushing on the tragus and external auditory meatus of the affected side
Indicates the presence of a perilymphatic fistula.
Gait tests:
Romberg's sign (not particularly useful in the diagnosis of vertigo 1)
Heel-to- toe walking test
Unterberger's stepping test 1 (The patient is asked to walk on the spot with their eyes closed – if the patient rotates to one side they have labyrinth lesion on that side
Dix-Hallpike manoeuvre 1
The most helpful test to perform on patients with vertigo1
If rotational nystagmus occurs then the test is considered positive for BPPV. During a positive test, the fast phase of the rotatory nystagmus is toward the affected ear, which is the ear closest to the ground.
Head impulse test/head thrust test
Useful in recognizing acute vestibulopathy 6
Caloric tests
Cold or warm water or air is irrigated into the external auditory canal
Not commonly used
Investigations/Testing to consider:
Special auditory tests
Audiometry helps establish the diagnosis of Ménière's disease
The history is most important and may give a quite good indication of the cause of vertigo. General medical causes such as anaemia, hypotension and hypoglycaemia may present with dizziness, and therefore should be investigated.
If features of CNS causes is suspected from the history or examination:
CT/MRI Brain imaging as appropriate
Treatment
Treatment should ideally aim at the cause of the vertigo 7:
Medical management – as described below.
Vestibular rehabilitation exercises – e.g. Cawthorne-Cooksey exercises 5.
These exercises aim to help the patient return to normal activity more quickly.
Moving the eyes from side to side and up and down while in bed or sitting down - then moving the head, first with your eyes open and then closed
Other forms use gaze and gait stabilising exercises. Most exercises involve head movement
For most patients the main priority is effective control of the symptoms.
For acute attacks, treatments include 5,8: -
Betahistine hydrochloride 8-16mg upto TDS
Cinnarizine, 15-30 mg TDS or
Prochlorperazine should be reserved for rapid relieve of acute symptoms only 8,12 - tablets 5-10 mg or buccal 3mg TDS or injection 12.5 mg IM or 25mg PR suppository - if vomiting
Preventive measures for recurrent attacks include:
Restrict salt and fluid intake - stop smoking and restrict excess coffee or alcohol 9,10
Betahistine hydrochloride 16mg regularly TDS seems most effective in Ménière's
Cinnarizine 15-30 mg TDS
Points to consider
Warn patients when drugs may sedate 10.
Prochlorperazine is less sedating than some other recommended antihistamines, but may cause a dystonic reaction (particularly in children and young women) 11.
Benzodiazepines are not recommended 9.
Recurrent vertigo
The most important first step in the management of recurrent vertigo is to distinguish vertigo from 'dizziness'.
In attacks of vertigo there is a sense of mobile disequilibrium ("the room spinning") which, if severe, results in uncontrolled staggering in one direction which may be only prevented by grabbing a solid object 10.
Epley's manoeuvre
a. Aims to remove debris from the semicircular canals and deposit it in the utricle where hair cells are not stimulated 11 b. Contraindications include 10: i. Severe carotid stenosis ii. Unstable heart disease iii. Severe neck disease (cervical spondylosis with myelopathy) iv. Advanced rheumatoid arthritisConsultation and referral:
Refer to secondary care if 10 :
Recurrent separate episodes
Neurological symptoms e.g. dysphasia, paraesthesiae or weakness
Associated sensorineural deafness
If there is an inadequate visualisation of the entire tympanic membrane or an abnormality (e.g. cholesteatoma)
Atypical nystagmus e.g. non-horizontal, persisting for weeks, changing in direction or differing in each eye
Positive fistula sign: pressure on the tragus reproducing symptoms (suggests endolymphatic fistula
If the patient has hearing problems in addition to vertigo then referral should be made to an ENT specialist. Other cases should be referred to a neurologist 10.
While awaiting referral:
Consider symptomatic drug treatment for no longer than 1 week because prolonged use may delay vestibular compensation
It is important that the person stops symptomatic treatment 48 hours before seeing a specialist, as it will interfere with diagnostic tests such as the Dix-Hallpike manoeuvre.
If the person's symptoms deteriorate, seek specialist advice.
When to consider hospitalization
Admit the patient to hospital if they have severe nausea and vomiting, and are unable to tolerate oral fluids 9.
Admit or urgently refer the person to a neurologist if they have:
Very sudden onset of vertigo (within seconds) that persists.
Acute vertigo associated with neurological symptoms or signs (e.g. new type of headache - especially occipital, gait disturbance, truncal ataxia, numbness, dysarthria, weakness) which may suggest CVA, TIA, or multiple sclerosis 9.
Admit or refer the person as an emergency to an ENT specialist if they have acute deafness without other typical features of Ménière’s disease (tinnitus and a sensation of fullness in the ear). Sudden onset unilateral deafness would suggest acute ischaemia of the labyrinth or brainstem, but can also occur with infection or inflammation.
Emergency treatment may restore hearing. The person should be seen within 12 hours of the onset of symptoms 9
The urgency of referral depends on the severity of symptoms (e.g. requirement for intravenous fluids because of excessive vomiting) and the suspected diagnosis 9.
Patient InformationThe Ménière's Society www.menieres.org.ukwww.patient.co.uk/doctor/Vertigo.htm
Urinary incontinence is a common and distressing condition. It is an underreported problem because of the stigma associated with the condition and many patients simply suffer in silence.
Definition
Urinary incontinence is defined as involuntary leakage of urine.
Prevelence
It has been estimated that in the United Kingdom (UK) 9.6 million women are affected by bladder problems.1, 2 An overactive bladder itself affects five million adults, nearly 1 in 5 of the over-40 population.3 Prevalence is estimated to be 15% among healthy older adults and 65% of old frail adults.4 It is twice as common in women than men. It can affect women of all ages including after childbirth. In a cross-sectional survey of adult females attending a primary care practice in the UK, nearly half had urinary incontinence but only a small minority sought help.5 Forty-two per cent of women affected wait up to 15 years before seeking treatment.6
Types
1. Stress incontinence: This is involuntary urine leakage on exertion such as coughing/laughing/sneezing or exercise. Stress incontinence is due to an incompetent urethral sphincter. It is largely caused by childbirth thus young women can develop this problem. Other causes include pelvic surgery or hysterectomy.
2.Urge incontinence:This is involuntary urinary leakage associated with urgency (a compelling desire to urinate that is difficult to defer) and is due to detrusor overactivity leading to detrusor contraction. Urge incontinence often appears later in life. Frequency or nocturia, with low volume of urine voided, are signs of an overactive bladder that can occur with or without urge incontinence.7 An overactive bladder affects both genders and its prevalence rises with age, affecting 16.7% of those aged 40 in North America and Europe.3 An overactive bladder should be managed in the same manner as urge incontinence.
3. Overflow incontinence
4. Mixed incontinence: This is both stress and urge incontinence.
Risk factors
The most important risk factor is being female. Others are:
Obesity
Pregnancy and childbirth
Obstruction - tumours in the pelvis or impacted stool
Hysterectomy 8
Neurological disease
Cognitive impairment
Burden
In 2001 the annual estimated cost of dealing with bladder problems was £353.6 million.9 This included expenditure on pads. It is expected to be much higher now. Only a small proportion of the above amount was spent on drugs,10 the remainder being spent on secondary care and surgical treatment.
Bearing this in mind, it makes sense that the general practitioner (GP) is ideally placed to screen and manage these patients in primary care. It is not necessary to refer all patients to secondary care. With the ever-increasing pressure on GPs to reduce unnecessary referrals, there is now a scope for commissioning this service. However, management of an overactive bladder is not part of the Quality and Outcome Framework - could be one reason why GPs are not keen or enthusiastic.
Primary care management
History
A good history makes the initial diagnosis. Ask the woman whether she leaks on coughing, sneezing or exertion (stress) or whether she has an urgent need to pass urine before the leakage (urge). If she gives a history of both, she probably has mixed incontinence.
A history of nocturia or frequency with low urinary volume means an overactive bladder. This should be managed in the same way as urge incontinence. Previous surgery, or an obstetric and gynaecology history, may give further clues as to the type of incontinence.
Examination
Abdominal examination - any palpable mass. This may be a palpable bladder, an ovarian cyst, or a large fibroid.
Pelvic examination - Prolapse, enlarged uterus due to fibroid. Inspection of the pelvic floor may show visible stress incontinence on straining or coughing.
Per-rectal (PR) examination if suspicion of constipation or faecal incontinence.
Investigations
Routine urine check for sugar and protein.
Mid-stream urine (MSU) to exclude urinary infection.
Bladder diary for three days. Ask the woman to complete a diary of time and fluid volume - intake and output with episodes of urinary leakage and her activity at that time. The charts are available from pharmaceutical companies (keep the booklets in your examination room).
National Institute for Health and Clinical Excellence (NICE) states that the use of cystometry, ambulatory urodynamics or video-urodynamics is not recommended before commencing non-surgical treatment.11
Treatment
Treatment depends on the type of incontinence. Pregnancy and childbirth are known risk factors and there is evidence that pelvic floor exercises during pregnancy reduce the risk. The exercises should be taught by the midwife during antenatal classes.
For stress incontinence, the first line therapy is three months of pelvic floor exercises. These should be taught by the practice nurse. An instruction leaflet on its own is not enough. There is good evidence that advising about pelvic floor exercises is an appropriate treatment for women with persistent postpartum urinary incontinence.12
For urge incontinence, bladder training is the first step. The patient should be taught to gradually increase the time between voids.
Life style advice in all with a body mass index (BMI) over 30kg/m2.11
Household modifications, mobility aids, downstairs toilets can help an elderly patient struggling to reach the toilet in time.
Regular prompting of patients, by residential or nursing home staff, to visit the toilet can make a considerable difference rather than putting a pad on.
Patients with an overactive bladder should be advised to reduce their caffeine and alcohol intake.
Encourage the patient to drink two litres of fluid a day. Many women reduce their fluid intake hoping that this would help the symptom control, but less fluid intake can lead to concentrated urine which can result in bladder irritation.
Antimuscarinic drugs such as oxybutynin can be used if bladder training is not successful. NICE recommends that immediate-release oxybutynin should be given as a first line.11 Transdermal oxybutynin can be given if oral oxybutynin is not tolerated. Compliance is often a problem because of side effects e.g. dry mouth, constipation, dry eyes, blurred vision, dizziness and cognitive impairment. Contraindications are acute angle glaucoma, myasthenia gravis, severe ulcerative colitis and gastro-intestinal obstruction.
NICE does not recommend duloxetine as a first or second line treatment for stress incontinence. It can be considered if there are persisting side effects with oxybutynin.
Desmopressin or tricyclic antidepressants can be used in women with nocturia.
The role of hormone replacement therapy (HRT) is debatable. Although oestrogens may improve atrophic vaginitis, there is no evidence that oestrogens by themselves are beneficial in incontinence.13
Pads and catheters should only be issued on prescription if all treatment options have failed and the patient is waiting to see a specialist. These are coping aids.
Referral to secondry care
GPs should refer patients to a urogynaecologist or a surgeon who has experience in this field. Extra-contractual referrals are not favoured by Primary Care Trusts (PCTs) - try convincing your PCT!
Refer if there is:
Pelvic mass
Frank haematuria
Symptomatic prolapse
Suspected neurological disease
Urogenital fistula
Previous pelvic surgery
Failure of conservative measures and anticholinergic drugs.
Chlamydia Screening In General Practice
Sexually transmitted infections are reaching epidemic proportions in Britain and Chlamydia is the commonest sexually transmitted bacterial infections.
Prevalence
Chlamydia is thought to be prevalent in 5-10% of 20-24 years old. About 75% of women and 50% of men are asymptomatic. The National Chlamydia Screening Programme currently finds about 8% of young people tested to be positive 1 but this may represent selective testing of higher risk individual.
National Chlamydia Screening Programme (NCSP)
This was initiated in 2003.The aims & objectives were early detection and treatment of asymptomatic infection, to reduce the onward transmission and to prevent the development of sequelae by screening all sexually active under the age of 25 years annually or with each change of sexual partner.
The positive rate for this group in 2008 was 8.7% 1.
An ideal setting to provide screening is General Practice. The nationally agreed target is for 25% of 15-25 years olds-males and females to be screened by 2009/2010 and 35% by 2010/2011.
Pathogenesis
Chlamydia is an intracellular bacteria and causes disease by chronic inflammation which is exacerbated by re-infection. It infects the female & male genital tract and is primarily sexually acquired. It can be carried in the throat, thus oral sex can transmit the bacteria.
Symptoms
Over 70% of women and 50% of men are asymptomatic.
Women may experience:
• post coital or inter- menstrual bleeding
• pelvic pain
• dysuria
• increased vaginal discharge
• P.I.D with infertility (10-40% incidence)
Men may experience:
• urethral discharge
• dysuria
• epididymo- orchitis
• urinary frequency
Symptoms in both men and women:
• rectal discharge
• rectal bleed following rectal infection
• pharyngeal infection - rare.
History
Early diagnosis and treatment will reduce the risk of long term complications. A detailed history of following should be taken-
1) History of discharge-Enquire about:
• colour & consistency of the discharge
• odour
• is it aggravated by sexual intercourse
• any associated itching
• when was it first noticed
• any past history of the discharge
• was it diagnosed and treated earlier
• any association of the discharge with menstrual cycle
2) Sexual history:
• date of last sexual intercourse
• were condoms used
• and if so were they used consistently
• regular partner or not
• any other partners in the last six months
• has she or her partner had sex with some one else of the same sex
• any history of sex with a partner from a different country
• any drug abuse in either the woman or her partner
3) Contraception and cytology:
• which contraception does she use
• any recent change of contraception
• whether she is up to date with cervical cytology
• whether all previous screens have been normal
4) Menstrual history:
• date of LMP
• are periods regular or have they altered recently
• any bleeding in between periods or after intercourse
5) History of sexually transmitted infection:
• any past history of STI
• was it treated
• was the partner also treated
• did they have a test of cure
6) Others symptoms:
• ower abdominal pain
• dysparunia
• dysuria
• any soreness or warts.
7) History of treatment:
• any medication been prescribed.
• any usage of over the counter medications
Examination
Examination of the female patient is usually normal but may show some muco -purulent discharge with contact bleeding. If pelvic inflammation is present there will be tenderness on uterine and adnexal bimanual palpation. The patient may sometimes be unwell with temperature. In suspected rectal chlamydia, Proctoscopy may be normal or may show changes of bloody/muco-purulent discharge or ulceration of mucosa.In men with epididymo-orchitis there may be epididymal and testicular tenderness with or with out systemic features.
Investigations
• The older less sensitive (EIAs) Enzyme immunoassays are replaced by Nucleic acid amplification tests (NAATs) .They are based on polymerase chain reaction technology.
• In some areas a combined NATT is in use for diagnosis of both Chlamydia & gonorrhoea. NATTs are not licensed for rectal or pharyngeal sampling.
• Men should have a first void urine sample tested. In symptomatic women an endocervical swab is the sample of choice. If the patient does not require a per speculum examination a blind vulvovaginal swab could be an appropriate sample. These are almost as accurate and have become the basis for self test kits, now available widely.
• A first catch urine (FCU) sample may be taken for women (having not passed urine for at least one hour before) but this is less sensitive in women than in men2
• Sexually transmitted infection screen should include serological testing for HIV and syphilis. Current guidelines for HIV testing can be found at www.bashh.org.
Prevention
No opportunity should be lost to discuss safe sex with young people at the time of new patient check up and when prescribing contraception. It is a good practice to screen Chlamydia with informed consent when performing cervical screening in sexually active women under 25 and those over 25 with two or more partners in the last year or a change of partner in the past year.
Management
• It is appropriate to treat Chlamydia in a general practice setting. Treatment is with either macrolides or tetracyclines.
• Oral Azithromycin (Zithromax) 1gm stat should be the first choice as it avoids compliance issues. Patients must be advised to avoid sex for 7 days after the treatment. An alternative is oral Doxycycline (Vibramycin) 100 mg twice daily for 7 days or oral Erythromycin (Erymax) 500 mg twice daily for 14 days.
• Interaction with oral contraceptive pill should be discussed. In pregnant women or those at risk of pregnancy, Azithromycin is still an option.
• Retesting to verify cure is not advocated, partly because of the high cure rate and partly the test using NAA may remain positive for up to five weeks causing confusion.
• All at risk partners in the last six months for females and asymptomatic males or four weeks for symptomatic males should be informed. They should be invited and treated even if the test is negative 3.The discussion and treatment can take place by the GP if the patient is registered with the practice or by referral to local genitourinary clinic.
Locally Enhanced Service
Each primary care trust has a Chlamydia screening officer. This year the target from the Department of Health is to screen 25% of patients aged 16 to 25 years registered at the practice who are sexually active.
Fee Structure
On agreeing a service plan with the PCT the general practice can receive: ( this may vary from one PCT to another PCT)
• £4.50 per test received in the laboratory for coverage of ≤ 10% of the practice population aged 15-24 years.
• £5.00 per test received in the laboratory for coverage of 10% to ≤20% of the practice population aged 15-24 years.
• £6.50 per test received in the laboratory for coverage of 20% to ≤25% of the practice population aged 15-24 years.
• £8.00 per test received in the laboratory for coverage of over 25% of the practice population aged 15-24 years.
How To Achieve Targets
• Do a computer search of all the target patients.
• Have a practice meeting
• Involve the whole team: practice nurses, health care assistants and receptionists
• Delegate, delegate and delegate! Practice nurses or health care assistants can screen at risk groups
• “new patient health check” is an ideal opportunity to offer screening. Involve the receptionist to hand out leaflets, forms and urine pots
• Make sure the reception area is suitable for handing out these items otherwise use a side room to ensure privacy
• Decide who would be dealing with positive results, treatment and partner notification
• To earn the money for extra effort you and your staff has made, make sure you use the appropriate read codeand ask the practice manager to send the claims monthly
• Remember only patients tested with in the practice premises are included when calculating the percentage screened
• Make sure you reward your staff appropriately with the money otherwise their enthusiasm may soon vanish
Emergency contraception (E.C) is also known as post-coital pill (PCC) or ‘the morning after pill’. It is the provision of preventing the establishment of a pregnancy following either an unprotected sexual intercourse or a potential contraceptive failure (1). Patients presenting to a general practitioner asking for emergency contraception should be seen and treated the same day. All the reception staff working in a surgery should be trained and patient requesting a PCC over the phone should be fitted in the surgery the same day.Teenage pregnancy is a public health priority (2) and government targets have been set to half the rate of conceptions in people under the age of 18 years in England by 2010 (3).Most people begin to consider sexual activity in adolescence(4).This is a period of psychological maturation.The UK has a higher teenage birth rate in Western Europe (5).About 90,000 teenagers in England become pregnant, resulting in 56,000 live births. Of these 2,200 are to girls aged 14 or under and 7,700 are to under 16 years age.There is a need to improve the provision of emergency contraception (6), but access to the service with in 72 hours can be difficult for young girls who may be worried about the confidentiality (2).
WHEN NEEDED
Emergency contraception is needed either because of split or slipped durex or a potential contraceptive failure e.g. late starter of the contraceptive pill on top of usual seven day break, forgetting to take the pill because of excessive alcohol intake or not taking precautions if vomiting/diarrhoea or antibiotic usage. Missing more than one pill in the first week of the pack could be another reason.Young women for whom sexual intercourse is often unpremeditated and therefore unprotected represents one of the most important groups requiring emergency contraception (7).
HISTORY
Before issuing a prescription, an accurate history to assess the risk of a pregnancy and whether an emergency contraception is needed must be taken (2).There may be a significant age difference between the patient and the partner or there could be an issue of abuse. General practitioner must have an access to local and national child protection guidelines. An accurate history of last menstrual period, usual cycle, date and time of last unprotected sexual intercourse and whether she has had other episodes of UPSI during that cycle should be recorded. History of current medication—enzyme inducing drugs e.g.antiepileptics, St John’s wort which could reduce the efficacy of E.C. should be taken.The only absolute contraindications are pregnancy or a history of serious allergy to any ingredient of the medication.Acute intermittent porphyria, severe liver disease, venous thromboembolism on anticoagulants, breast cancer is some of the relative contraindications.
EXAMINATION
Physical examination should include measurement of height, weight, and blood pressure. A routine urine check for protein & sugar should be done. Advice and help regarding smoking, alcohol and drugs should be given if needed. A pelvic examination is only necessary if an infection is suspected or if the IUCD method is used.
TREATMENT
Two methods are available in the UK-
1) Hormonal method. This contains 1.5 mg of Levonorgestrel (LNS) and is given as a single dose as soon as possible after an UPSI. This is available on the prescription as Levonelle 1500 or as purchase by women over sixteen at pharmacies as Levonelle One Step, both by Schering Health UK. Only those pharmacists who have undertaken training and signed Patient Group Direction (PGD) can dispense the pill.
The sooner it is taken, the greater the efficacy
0 - 24 hours 95% efficacy
25 – 48 hours 85% efficacy
49 -- 72 hours 58% efficacy
It is licensed to be prescribed with in 72 hours of UPSI, although it is known to have some efficacy for up to 120 hours but effectiveness decreases the longer the delay. It acts by interrupting the follicular development and ovulation. There is no effect on implantation. Side effects with E.C are rare. Nausea is reported in 15% of cases and vomiting in 1-2 % cases. If vomiting occurs with in two hours of taking the pill, the patient should return for a repeat dose of Levonelle 1500(1).Irregularity of cycle is another side effect.50% of women reported bleeding a few days earlier or later than expected and 16% had bleeding unrelated to menses within the next seven days (8). Cramps, headaches, dizziness and breast tenderness could be some other side effects. Because this is a progestogen, the oestrogen related cardiovascular risks are not a concern.
2) Copper containing IUCD (not Mirena). This is more effective and prevents nearly 100 % of pregnancies. It has both pre and post ovulation effects .The toxicity of copper prevents fertilisation. If inserted later in the cycle, it causes an inflammatory reaction in the endometrium; preventing implantation (9).It can be inserted with in five days (120 hours) after UPSI. If intercourse has occurred more than five days previously, an IUCD can still be inserted up to five days after the earliest likely calculated ovulation. Before inserting the coil a pelvic examination and swabs should be taken to exclude sexually transmitted diseases. If patient is at a risk, treatment with 1 Gm, Azithromycin should be given. Absolute contraindications to the coil insertion are few and same as to the routine use of coil. This is a better option if patient is taking enzyme inducing drugs such as antiepileptic or St John’s wort.
FOLLOW UP
All patients should be followed up in three or four week time after prescribing a PCC or the coil insertion.
No emergency contraception is 100% effective. Pregnancy should be excluded by doing a pregnancy test if period is late by one week or more. If patient is pregnant various options regarding termination/continuation/adoption should be discussed.Regular methods of contraception should be discussed and advice should be given regarding safe sex. If indicated screening for STD should be done. A general practitioner can do a lot to reduce the burden of STI. Chlamydia screening in England varies from area to area. One can visit www.chlamydiascreening.nhs.uk to find out what is happening in one’s practice area. NICE and the national Collaborating Centre for women and children’s health have produced a guideline recommending that Long Acting Reversible Contraception (LARC) should be offered to all women as part of their contraceptive choices after emergency contraception.
CONCLUSION
There is an increased awareness of emergency contraception although the confusion exists particularly among those aged 16-20 years regarding the time limit for its effectiveness. Every GP practice should have a practitioner with an interest in family planning and sexual health or a family planning trained nurse.